Figures & data
Figure 1. Annual variations in abundance (no. individuals) of Jujubinus striatus and Jujubinus exasperatus for each month, obtained by pooling data from all sampled depths.
Figure 2. Monthly variations in abundance (no. ind./20 m2) of Jujubinus striatus and Jujubinus exasperatus, at each sampled depth.
Figure 3. Size-frequency distributions of Jujubinus striatus, with the number of collected specimens (n), from the whole transect.
Figure 4. Size-frequency distributions of Jujubinus exasperatus, with the number of collected specimens (n), from the whole transect.
Figure 5. Growth curves for the identified cohorts of Jujubinus striatus (a) and Jujubinus exasperatus (b), obtained by considering pooled data for all sampled depths. The dots represent the modal size monthly of height–frequency distributions.
Figure 6. Survivorship curves for Jujubinus striatus and Jujubinus exasperatus, derived from size–frequency distribution of measured shells collected at all depths in 1 year of sampling (July 1981–June 1982).
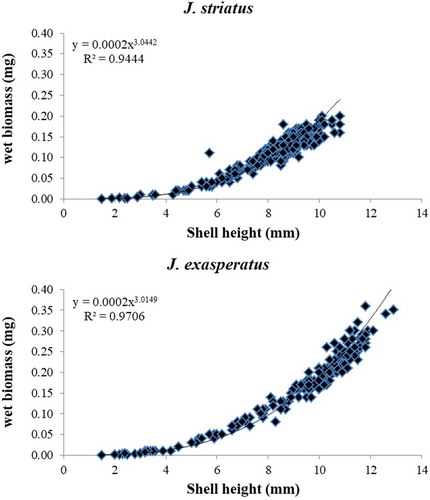
Figure 7. Increase in shell height frequency in relation to wet biomass (mg), for each Jujubinus population and relative equation parameter of the curve, in 1 year of sampling (July 1981–June 1982).