Figures & data
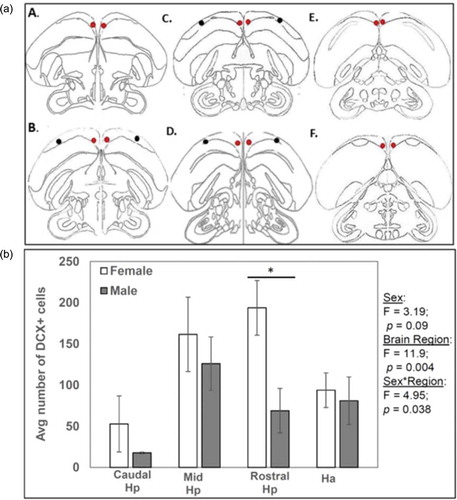
Figure 1. Photomicrographs illustrating the different doublecortin positive (DCX+) cell types observed in the cowbird hippocampus (Hp). As described in Boseret et al. (Citation2007), four types of DCX cells can be observed in the songbird brain: (1) densely stained round multipolar cells, (2) fusiform elongated cells, (3) weakly stained round cells with few immunolabelled processes detected, and (4) weakly stained cells associated with punctate structures. (A) Densely stained round multipolar cells with labelled neurites were observed only against the midline of the Hp near the ventricle dividing Hp from neostratium, and (B) weakly stained round cells with few immunolabelled processes detected were also observed in all sub-regions of Hp. The white arrows indicate the types of cells counted in this study. Photomicrographs were taken using a 40× objective. Scale bars = 20 µm.
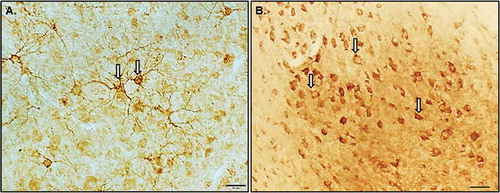
Figure 2. Schematic drawings of coronal sections illustrating the regions examined along the rostral-caudal extent of the hippocampus (Hp). (a) A and B represent the range of sections included in the rostral Hp category. C and D represent the mid-Hp category, and E and F represent the caudal Hp category. Red dots represent areas quantified for Hp doublecortin immunoreactivity (DCX-ir) cell counts whereas black dots represent regions within the Ha (hyperpallium apicale; Ha) in which DCX cells were counted as a control. The illustrations are based on Stokes et al. (Citation1974). (b) Results of a multivariate analysis of variance (MANOVA) are represented with sex and Hp sub-region as well as Ha as explanatory factors. The average number of DCX+ cells was calculated from three 1.66 × 1.24 mm sampling frames for each hippocampal sub-region.