
Figures & data
Figure 1. Reference point for body (a) and cranial (b) parameters collected from fawns adults taken by hunters: live weight (LW), head–trunk length (HTL), height at shoulders (HS), chest circumference (CC), length of hock (HL), total length of the cranium (TL), condilo-basal length (CBL), mastoid width (MW), zygomatic width (ZW), ectorbital width (ECW), entorbital width (ENW), length of the teeth row (TRL), mandible length (ML)
Figure 2. Map of the carrying capacity for roe deer (green box), with an example of a Management District of the ATC-MC2 (red box) and of Management Units within a Management District (blue box). The colors in the map indicate the carrying capacity for roe deer: 0 animals/hectare (white); 0.02 animals/hectare (yellow); 0.06 animals/hectare (brown); 0.20 animals/hectare (green)
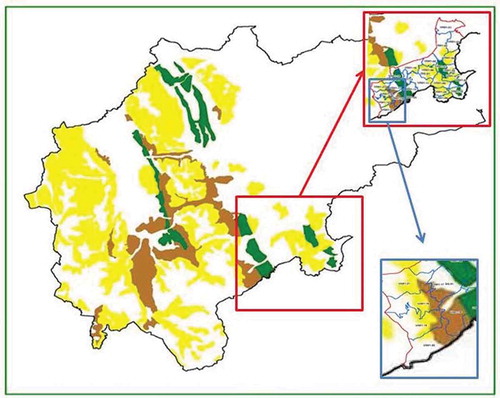
Table I. Body and cranial measurements (mean ± standard deviation) of roe deer pertaining to age classes 0 and 2 per sex (F – female; M – male). Significance values (p) for the variable “sex” are indicated when this variable was included in the best model, following an AIC-based model selection procedure. p-values are adjusted using the Holm correction for multiple testing
Table II. Body and cranial measurements (mean ± standard deviation) of roe deer pertaining to age class 0 (fawns) per environmental category (1 = 0–0.02 animals/hectare, with lower food availability; 2 = 0.03–0.1 animals/hectare, with intermediate food availability; 3 = 0.11–0.13 animals/hectare, with higher food availability). Significance values (p) for the ordered factor “environmental category” are indicated when this variable was included in the best model, following an AIC-based model selection procedure. p values are adjusted using the Holm correction for multiple testing
Figure 3. Box-plot diagrams of body parameters (based on observed values) of fawns divided by sex (m – male; f – female) within environmental categories (1–3)
Figure 4. Box-plot diagrams of cranial parameters (based on observed values) of fawns divided by sex (m – male; f – female) within environmental categories (1–3)
Figure 5. Reference point for body (a) and cranial (b) parameters collected from fawns. With the asterisk are evidenced the significantly different parameters among environmental categories: length of hock (HL), total length of the cranium (TL), condilo-basal length (CBL), zygomatic width (ZW)

Table III. Body and cranial measurements (mean ± standard deviation) of Roe deer pertaining to age class 2 (adults) per environmental category (1 = 0–0.02 animals/hectare, with lower food availability; 2 = 0.03–0.1 animals/hectare, with intermediate food availability). Significance values (p) for the ordered factor “environmental category” are indicated when this variable was included in the best model, following an AIC-based model selection procedure. p-values are adjusted using the Holm correction for multiple testing
Figure 6. Box-plot diagrams of body parameters (based on observed values) of adults divided by sex (m – male; f – female) within environmental categories (1–2)
Figure 7. Box-plot diagrams of cranial parameters (based on observed values) of adults divided by sex (m – male; f – female) within environmental categories (1–2)
Figure 8. Reference point for body (a) and cranial (b) parameters collected from adults. With the asterisk are evidenced the significantly different parameters between sexes: live weight (LW), head–trunk length (HTL), length of hock (HL), zygomatic width (ZW)

Figure 9. Reference point for body (a) and cranial (b) parameters collected from adults. With the asterisk are evidenced the significantly different parameters between environmental categories: live weight (LW), head–trunk length (HTL), chest circumference (CC), length of hock (HL), ectorbital width (ECW), length of the teeth row (TRL)
Appendix 1. Results of the selection procedure, performed using the glmulti R-package, to identify the best models for each parameter in each age class, using AIC as selection criterion, with sex and environmental category (Env) as explanatory variables. Best AIC, model weight of the best model and the selected variables are indicated. The procedure had stopped when no variable was selected. The explanatory variables selected were tested using the rfit function of the Rfit R-package. Intercept, slope and significance values are indicated for every model