Figures & data
Table I. Diagrammatic representation of the collection of adult specimens of L. forficatus. F – females, M - males
Figure 1. Scheme of experimental setup described in 2.1.2. chapter
Figure 2. Cadmium concentration [mg ∙ l−1] in the experimental groups: control, Cd1 and Cd2. Mean ± SE. Different letters (a, b) mean statistically significant differences at p ≤ 0.05. One-way ANOVA, Tukey’s test, n = 5–6
![Figure 2. Cadmium concentration [mg ∙ l−1] in the experimental groups: control, Cd1 and Cd2. Mean ± SE. Different letters (a, b) mean statistically significant differences at p ≤ 0.05. One-way ANOVA, Tukey’s test, n = 5–6](/cms/asset/48a1878d-10f9-45b3-9152-266fe0411b30/tizo_a_1757168_f0002_b.gif)
Figure 3. Diagrammatic representation of the midgut epithelium in L. forficatus. Digestive cells (dc), secretory cells (sc), regenerative cells (rc), basal lamina (bl), visceral muscles (vm), midgut lumen (l)
Figure 4. The midgut epithelium of L. forficatus – the control group (C group)
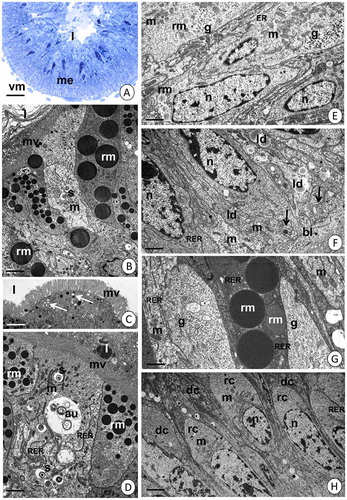
Figure 5. The midgut epithelium of L. forficatus – animals treated with cadmium for 12 days (Cd1 group)
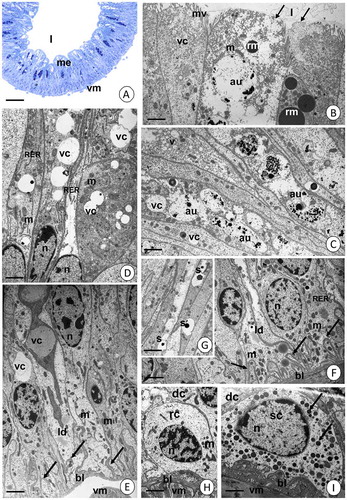
Figure 6. The midgut epithelium of L. forficatus – animals treated with cadmium for 45 days (Cd2 group)
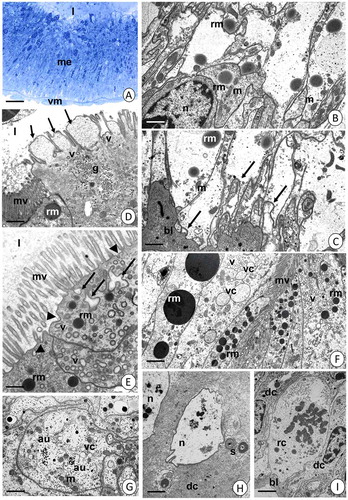
Figure 7. Autophagy in the midgut epithelium of L. forficatus.
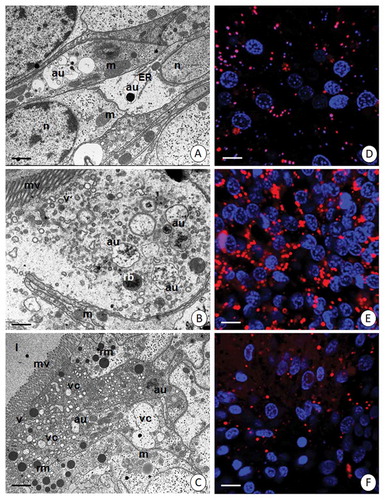
Figure 8. Percentage of autophagic cells in intestine of L. forficatus from the control group (C) and exposed to cadmium (Cd1, Cd2). Different letters (a, b, c) indicate significant differences between experimental groups (x ± SE; Tukey’s test, p < 0.05); n = 6
Figure 9. Apoptosis and necrosis in the midgut epithelium of L. forficatus.
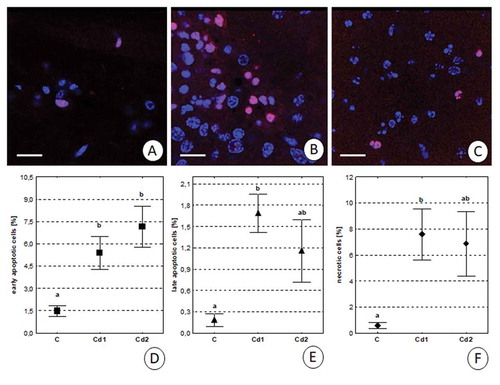
Table II. Concentrations of ATP (x± SE) and ADP/ATP ratio (x± SE) in intestine of L. forficatus from the control group (C) and groups exposed to cadmium (Cd1, Cd2). The different letters (a, b) indicate significant differences between experimental groups within each parameter (Tukey’s test, p < 0.05); n = 4–5
Figure 10. Hemocytes in the neighborhood of L. forficatus midgut. (a) Hemocytes (hc) in animals from the control group. Digestive cells (dc), basal lamina (bl), electron dense granules (black arrows), mitochondria (m), visceral muscles (vm), nucleus (n). TEM. Scale bar = 2 µm. (b) Hemocytes (hc) located among digestive cells. Animals treated with cadmium for 12 days. Digestive cells (dc), basal lamina (bl), nucleus (n), electron dense granules (black arrows). TEM. Scale bar = 1.5 µm. (c) Hemocytes (hc) located in the hemocoel in the neighborhood of visceral muscles (vm) and basal lamina (bl). Animals treated with cadmium for 45 days. Digestive cells (dc), electron dense granules (black arrows), mitochondria (m), cisterns of ER (ER). TEM. Scale bar = 0.6 µm