
Figures & data
Figure 1. Study area.
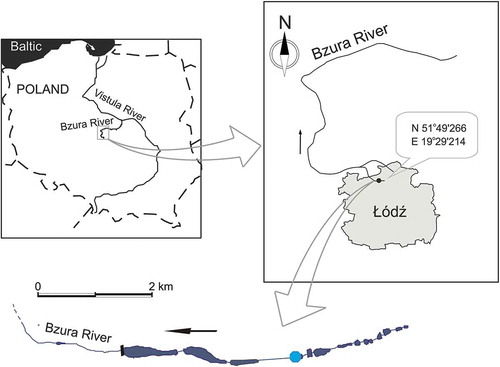
Table I. Physico-chemical parameters for the sampling site. SI - inorganic substrate index, pH – acidity. SD- standard deviation.
Figure 2. Catalase (CAT) activity and level of reduced glutathione (GSH), lipid peroxidation (LPO) and total antioxidant capacity (TAC) in the four studied chironomid species.
Figure 3. Activity of glutathione S-transferase (GST) in the four studied chironomid species.
Table II. Differences (ANOVA) between taxa studied for parameters examined; df (3,32) Post hoc differences: 1 – Chironomus riparius, 2 – Prodiamesa olivacea, 3 – Paratanytarsus sp. 4 – Conchapelopia melanops df – number of degrees of freedom CAT – activity of catalase GSH – the level of reduced glutathione GST – activity of glutathione S-transferase MDA – level of malondialdehyde TAC – total antioxidant capacity.
Table III. Pearson correlaton coefficients between selected chironomidae taxa and investigated parameters. C. rip. – Chironomus riparius, P. oli. – Prodiamesa olivacea, Para. – Paratanytarsus sp., C. mel. – Conchapelopia melanops CAT – activity of catalase GSH – the level of reduced glutathione GST – activity of glutathione S-transferase MDA – level of malondialdehyde TAC – total antioxidant capacity.