Figures & data
Figure 1. Bacterial phyla present in nest material and in profiles of Pella laticollis and Lasius fuliginosus individuals
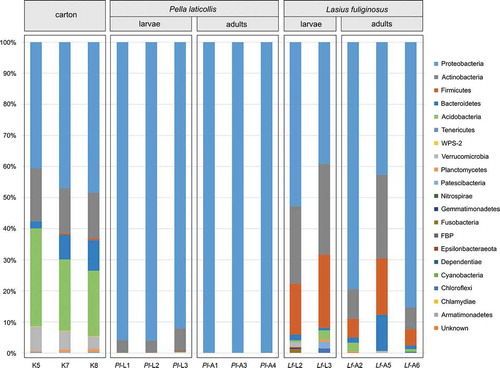
Table I. Results of PERMANOVA analysis after 999 permutations. Values above diagonal indicate p values. Groups were determined according to the sample origin
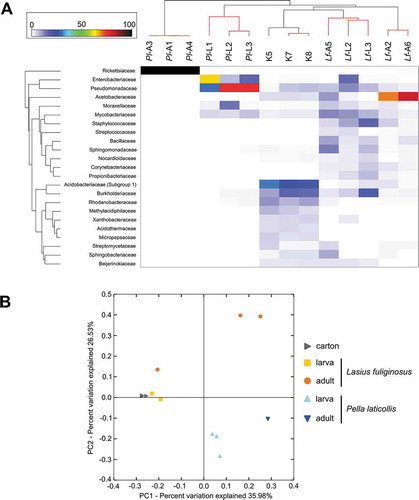
Figure 2. The heatmap showing relationships among tested profiles of bacterial communities and the Principal Coordinate Analysis (PCoA) plot. (a) – The heatmap showing bacterial families distributed across tested samples. Only those families which were primarily responsible for the observed differences among samples were considered. Both dendrograms were estimated with the Bray-Curtis dissimilarity index; (b) – PCoA of bacterial communities associated with tested specimens based on weighted UniFrac distances