Figures & data
Table I. Differences in mean linear measurements between male and female adult Blacksmith Lapwings, with the sexual dimorphism index (SDI) according to Lovich and Gibbons (Citation1992) expressed in percent and the coefficient of variation (CV)
Figure 1. Relationship of the most dimorphic traits in male (black dots) and female (white dots) Blacksmith Lapwings against the tarsus length. The ellipses show the 95% prediction intervals for a single observation, given the parameter estimates for the bivariate distribution computed from the data for males (solid line) and females (dashed line)
Table II. Equations for calculating discriminant scores. The percentage of birds correctly sexed is given from the jackknife procedure. TL – tarsus length, THL – total head length, WL – wing length, BM – body mass. SL – spur length
Figure 2. Distribution of the discriminant score D1 calculated for females and males sexed molecularly. Grey bars – correct, white bars – incorrect classification. Dotted lines show D1 with cut-off values of −0.96 and 1.43; dashed lines indicate cut-off values of −0.86 and 0.90, which enabled correct classification for 95% of males and 90% of females
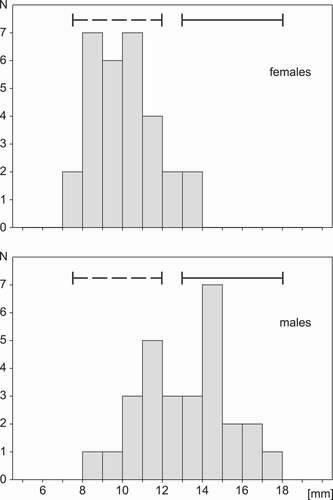
Figure 3. Distribution of the spur length in adult female and male Blacksmith Lapwings sexed molecularly, showing the range of spur lengths for females (dashed line) and males (solid line) given by Tree (Citation1999)