Figures & data
Figure 1. Myotis daubentonii and M. capaccinii European distribution following the IUCN Red List data (Kruskop et al. Citation2020; Hutson et al. Citation2010) (a), their occurrence localities in the study area (b), the three-dimensional plot showing the overlap of their Hutchinsonian climatic niche and (c) binarized predictions for the current scenario, also considering the areas of sympatry (d)
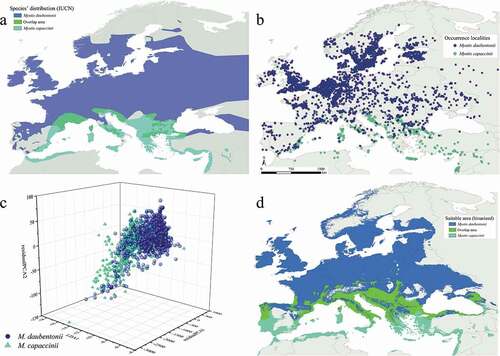
Figure 2. Predicted suitable areas for current climatic conditions for Myotis daubentonii (a) and M. capaccinii (b); distribution of the four shared and most contributing current bioclimatic variables for both species (c–f)
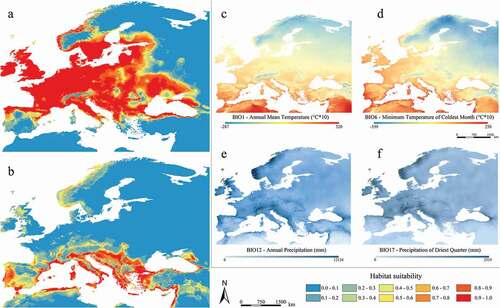
Table I. Variables’ relative contribution inferred from the Ensemble Modelling process for the two target bat species, with BIO1 (Annual Mean Temperature), BIO2 (Mean Diurnal Range), BIO6 (Minimum Temperature of Coldest Month), BIO12 (Annual Precipitation), BIO17 (Precipitation of Driest Quarter)
Figure 3. Marginal response curves of the five predictors used for the modelling process and the density of predicted suitability read within the sympatric area in the occurrence localities, for Myotis daubentonii and M. capaccinii.
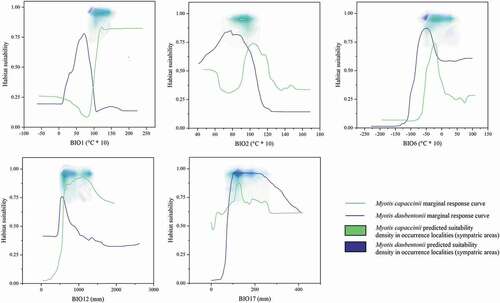
Figure 4. Predicted suitable areas for the Mid-Holocene climatic conditions for Myotis daubentonii (a) and M. capaccinii (b); distribution of the four shared and most contributing Mid-Holocene bioclimatic variables for both species (c–f)
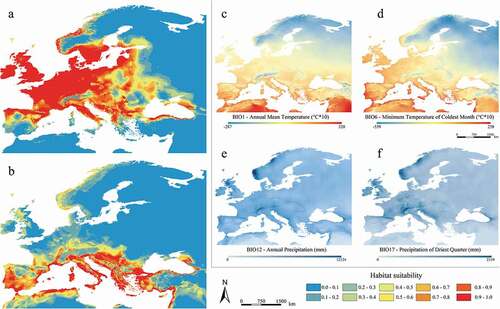
Figure 5. Predicted suitable areas for the Last Glacial Maximum climatic conditions for Myotis daubentonii (a) and M. capaccinii (b); distribution of the four shared and most contributing Last Glacial Maximum bioclimatic variables for both species (c–f)
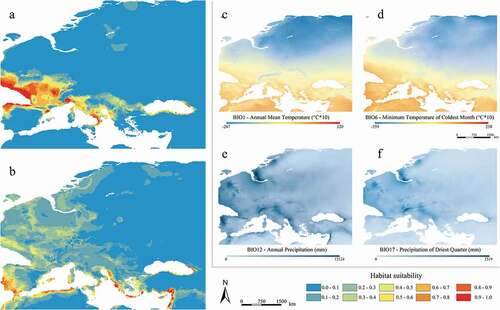
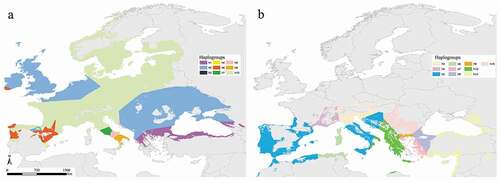
Figure 6. Haplotype network inferred from the binarized current predictions and the genetic information from Nardone (Citation2015) for Myotis daubentonii (a) and Viglino (Citation2012) for Myotis capaccinii (b)