Figures & data
Figure 1. Map of sampling sites. (a): Overview of French Polynesia in the South Pacific Ocean. (b,c): Sampling site at Nuku Hiva Island (Marquesas Islands). (d,e): Sampling site at Tahiti Iti peninsula. Red arrows indicate the position of caves where lithistids were collected
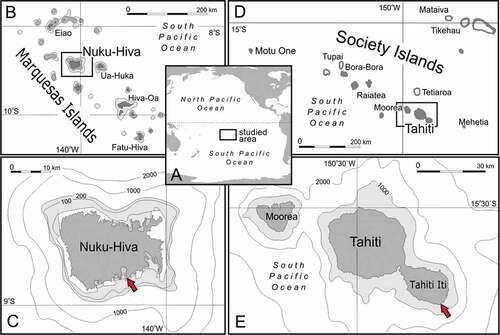
Figure 2. Levispongia meyeri gen. nov. sp. nov. (a,b): Paratype specimen MNHN-IP-2019-3; (a): lateral view; (b): top view. (c–e): Holotype specimen MNHN-IP-2019-2; (c): top view, (d,e): lateral views
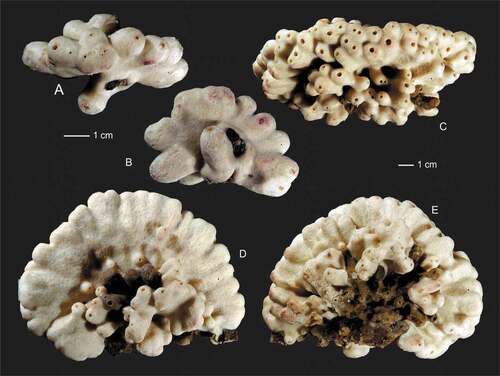
Figure 3. Choanosomal desma skeleton of the holotype Levispongia meyeri gen. nov. sp. nov. (MNHN-IP-2019-2). (a–d): Details of choanosmal desmas skeleton formed by tuberculated dicranoclones. (e–f): details of the desma skeleton with young and less tuberculated spicules inserted
Figure 4. Mega- and microscleres of holotype Levispongia meyeri gen. nov. sp. nov. (MNHN-IP-2019-2). (a–c) & (h–j): short thick spined microrhabds. (d–g): long slightly curved and spined microrhabds. (k–m): microstyles. (n–r): dichotriaenes in various views
Figure 5. Outer growth form of new rhizomorine lithistids. (a,b): Paratype (MNHN-IP-2019-12) of Microscleroderma miritatarata sp. nov. (c): Holotype (MNHN-IP-2019-11) of Microscleroderma miritatarata sp. nov. (d–f): Paratype (MNHN-IP-2019-9) of Gastrophanella basaltica sp. nov. (g,h): Holotype (MNHN-IP-2019-7) of Gastrophanella basaltica sp. nov. (i–k): Holotype (MNHN-IP-2019-10) of Microscleroderma lava sp. nov
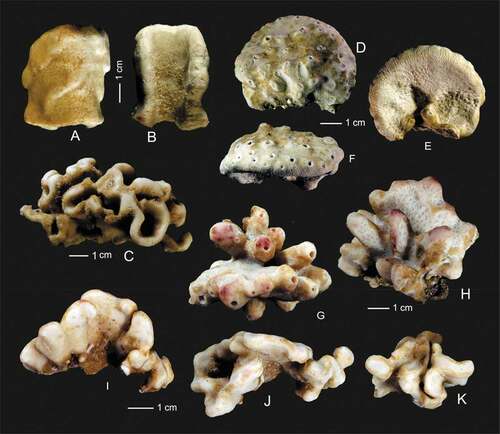
Figure 6. Ectosomal surface and choanosomal skeleton of Gastrophanella basaltica sp. nov., (holotype MNHN-IP-2019-7). (a): Ectosomal natural surface with protruding exotylostyles. (b–d): details of choanosomal rhizomorine desmas
Figure 7. Microscleres of Gastrophanella basaltica sp. nov. (holotype MNHN-IP-2019-7). (a–d): exotylostyle microscleres. (e,f): details of spinose heads of exotylostyles
Figure 8. Microscleroderma lava sp. nov. (holotype MNHN-IP-2019-10). (a,b): natural surface with ectosomal hair-like oxeas randomly distributed. (c–f): Details of the choanosomal skeleton composed of rhizoclone desmas forming a dense network
Figure 9. Sigmaspire microscleres of Microscleroderma lava sp. nov. (holotype MNHN-IP-2019-10)
Figure 10. Surface of Microscleroderma miritatarata sp. nov. (a,b): Holotype specimen MNHN-IP-2019-11. (c,d): Paratype specimen MNHN-IP-2019-12 with D showing the membrane around ostium with several sigmaspire microscleres embedded
Figure 11. Choanosomal skeleton of Microscleroderma miritatarata sp. nov. Details of rhizoclone desmas of the holotype specimen MNHN-IP-2019-11. (a–c): represent one side of the surface. (d–f): represents the opposite side of the surface
Figure 12. Choanosomal skeleton of Microscleroderma miritatarata sp. nov. Details of rhizoclone desmas of the paratype specimen MNHN-IP-2019-12. (a–c): represent one side of the surface. (d–f): represents the opposite side of the surface
Figure 13. Sigmaspires of Microscleroderma miritatarata sp. nov. (a–e): Sigmaspires of holotype specimen MHNH-IP-2019-11. (f–j): Sigmaspires of paratype specimen MHNH-IP-2019-12
Figure 14. Bayesian inference (BI) reconstruction of the 28S rDNA gene (C1-D2 region) showing the relationship of Levispongia meyeri sp. nov. (in red) to other genera within the family Corallistidae. Bayesian posterior probability values are indicated for clades >0.75 otherwise not given. Numbers following the taxon names are collection numbers or NCBI Genbank accession numbers
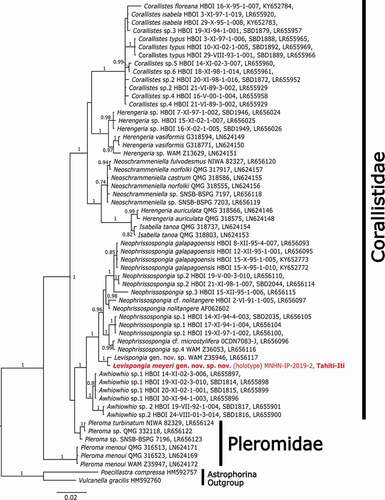
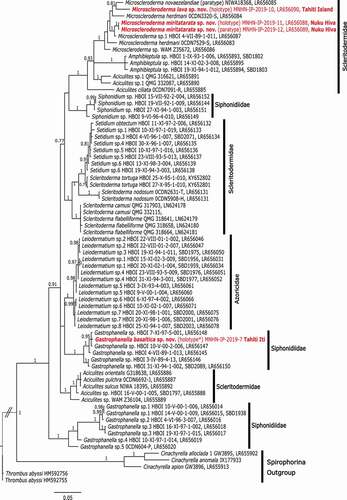
Figure 15. Bayesian inference (BI) reconstruction of the 28S rDNA gene (C1-D2 region) showing the relationship of the new species (in red) to other spirophorin species. Bayesian posterior probability values are indicated for clades >0.75 otherwise not given. Numbers following the taxon names are collection numbers or NCBI Genbank accession numbers