
Figures & data
Table I. Origin and GenBank Accession Numbers (A.N.) of the analysed Placobdella costata specimens. Geographical coordinates are expressed in terms of decimal degrees (Map Datum: WGS84)
Figure 1. Geographic location of the sampled sites. See for their coordinates and information on the collected Placobdella costata specimens and their hosts. Codes refer to those listed in . The geographic coordinates of the Portuguese and Iranian sites are unknown; accordingly, orange and yellow dots show their approximate locations
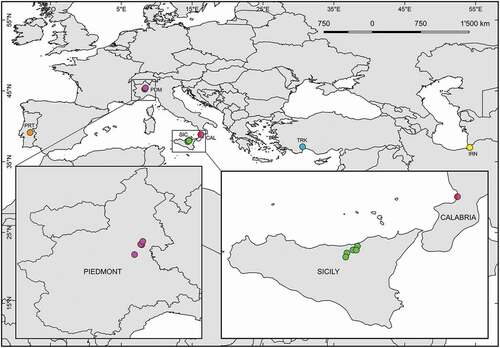
Figure 2. (a) Bayesian phylogram (95% majority rule consensus tree) of Placobdella costata based on a 540 bp fragment of the mtDNA COI. A sequence of P. ornata (A.N. JQ812136) was used as an outgroup to root the tree. See for the geographic origin of each sequence. Novel sequences are reported in bold. Node statistical support is reported as nodal posterior probabilities (Bayesian Inference of phylogeny, BI)/bootstrap values (Maximum Likelihood, ML). Asterisks indicate a bootstrap support value lower than 50. The colours of the pie chart refer to those shown in Figure 2(b) and refer to the hosts (Emys spp.) of the parasite (P. costata) in each analysed area. (b) Bayesian phylogram (95% majority rule consensus tree) of Emys spp. based on a 1031 bp fragment of the mtDNA Cytb. Node statistical support is reported as nodal posterior probabilities (Bayesian Inference of phylogeny, BI)/bootstrap values (Maximum Likelihood, ML). (c) Median-joining haplotype network based on the mtDNA COI of Placobdella costata. Dashes indicate substitutions steps. Each circle represents a haplotype, and its size is proportional to its frequency. All the analysed specimens are reported using the codes listed in
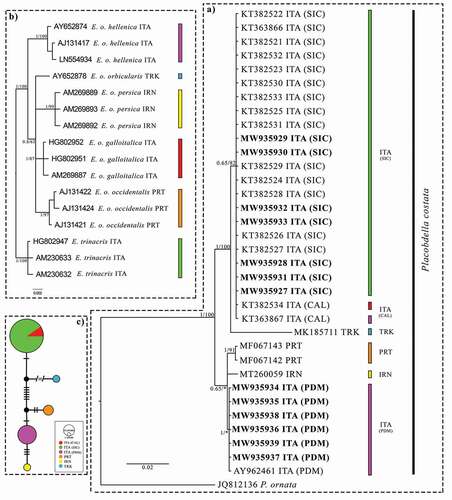
Table II. Pairwise uncorrected p-distance between the cytochrome oxidase subunit 1 (COI) haplotypes observed in Placobdella costata. Codes refer to those listed in