Figures & data
Figure 1. Global distribution of drylands (top: aridity index < 0.65; Trabucco & Zomer Citation2009), relative proportion of dry sub-humid, semi-arid, arid and hyper-arid categories (bottom left) and percentage of protected areas in drylands afforded by each category (left small inset), and cumulative number of protected areas and their area established in drylands (bottom right) (IUCN and UNEP-WCMC Citation2019)
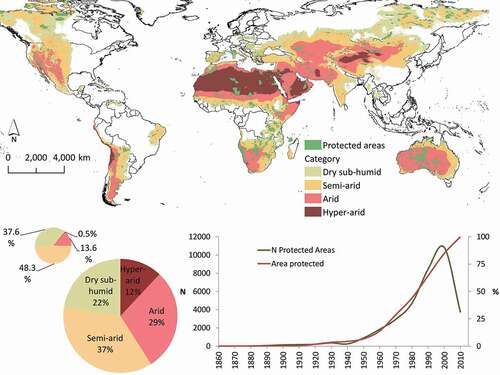
Table I. Selection of direct threats acting on drylands, local conservation actions being developed, and research needs for biodiversity conservation and sustainable human development. Numbering and nomenclature follow IUCN (Citation2019) classification schemes of Threats, Conservation Actions, and Research Needs
Figure 2. Relationships between average regional values of socioeconomic indicators in 70 dryland countries. Global peace (low values = more peace) and global terrorism (low values = less terrorism) indexes (top left), human development (HDI) and corruptions perception (low values = more corruption) indexes (top right), and net migration rate (per 1,000 people) (bottom left), and international tourist arrivals (millions) (bottom right). Regions: North America (Dark blue), South America (Light blue), Europe (Yellow), North Africa (Dark Orange), South Africa (Light Orange), West Asia (Dark green), East Asia (Light green), and Australia (Grey). Indexes and data from IEP (Citation2018a, Citation2018b), UNDP (Citation2018), UNWTO (Citation2018), and Transparency International (Citation2019)
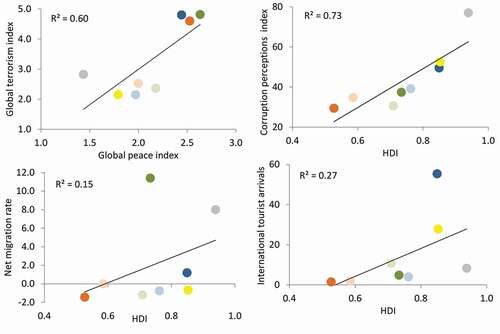
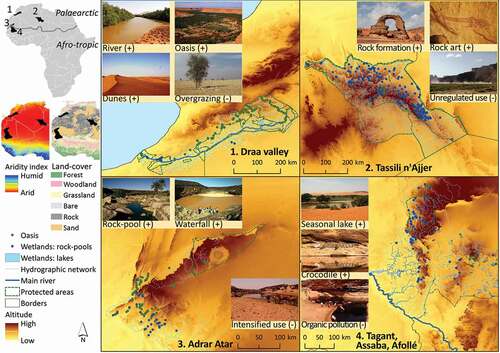
Figure 3. The wetlands of the west Sahara-Sahel. Location of four hydrographic networks in the African context (left insets), distribution of 696 wetlands and 181 oases, and a selection of pictures of values (+) and pressures (-) associated to wetlands