Figures & data
Table I. Alpha diversity of gut microbiota in feces samples from Himalayan tahr
Figure 1 (A)Rarefaction curves and (B) rank abundance curves of each sample. The saturated rarefaction curves and species richness indices indicate that the dominant taxa present were captured. The rank abundance curves reveal an evenness of bacterial species in the fecal samples of tahrs
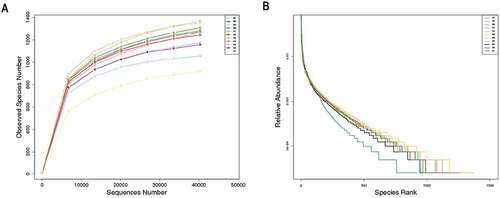
Figure 2. Venn diagram of OTUs
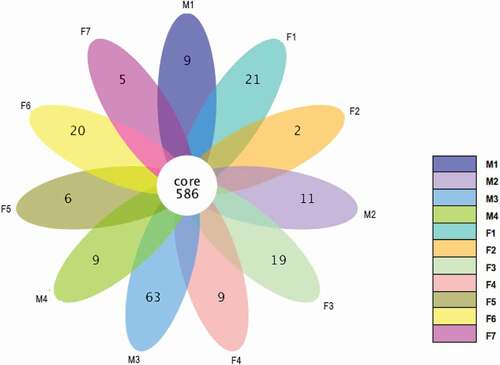
Table II. Relative abundance of the top 10 most abundant bacterial phyla in the tahrs
Table III. Relative abundance of the top 10 most abundant bacterial genera in the tahrs
Figure 3. Fecal microbial composition of tahrs at the (A) phylum and (B) genus level. M: male group; F: female group
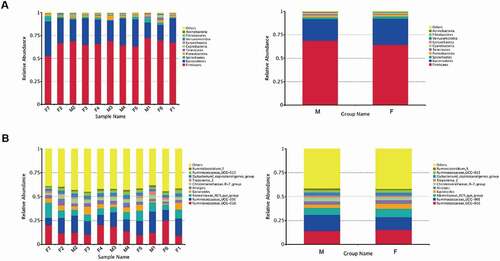
Figure 4. A heatmap of species abundance clustering. The heatmap shows the hierarchical clustering of samples based on the relative abundance of the 35 top-ranked genera of fecal microbiota in tahrs
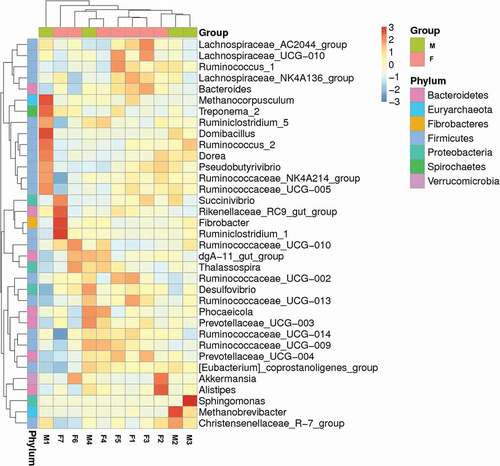
Figure 5. Cluster analysis with the weighted Unifrac distance matrix. Dendrogram branches were determined using UPGMA clustering method
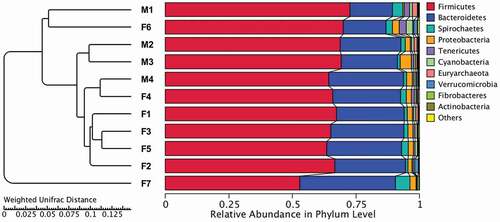
Figure 6. Comparisons of alpha diversity (Shannon and observed species index) and beta diversity (with weighted and unweighted Unifrac distance matrix) in fecal microbiota between groups by sex difference. M: male group; F: female group
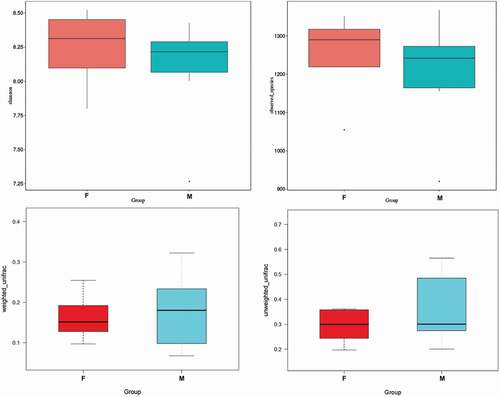
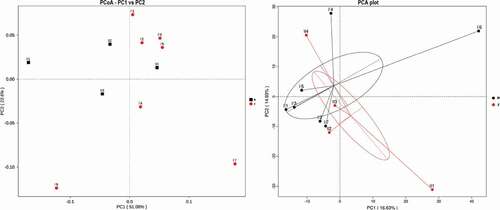
Figure 7. Principal coordinate analysis (PCoA) and principal component analysis (PCA) of bacterial community structures. Symbols represent the gut microbiota of individuals, and the different colors represent the different groups. M: male group; F: female group