Figures & data
Table I. Localities and GenBank accession numbers of specimens used for the current study. N – 54
Figure 1. Phylogenetic relationships of Dikerogammarus species based on maximum-likelihood gene trees (left) and haplotype networks (right) of the COI and 28S fragments. Numbers above tree branches represent statistical support (ultrafast bootstrap and Shimodaira-Hasegawa approximate likelihood ratio test). Colored boxes next to the trees indicate the results of the species delimitation analyses. Numbers within the mPTP column are posterior probabilities for species support.
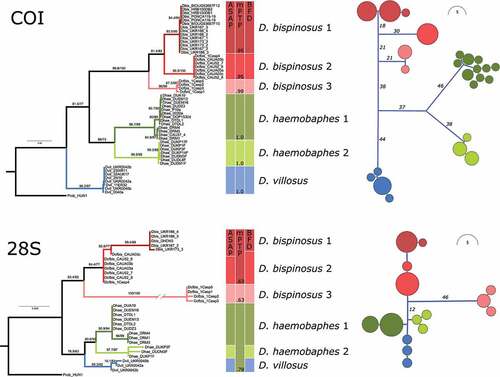
Figure 2. Phylogeny of Dikerogammarus based on a combined COI and 28S dataset. Left, time-calibrated Bayesian species tree. Numbers above branches are posterior probabilities. Right, maximum-likelihood tree based on locus concatenation. Numbers above branches represent statistical support from ultrafast bootstrap and the Shimodaira-Hasegawa approximate likelihood ratio test.
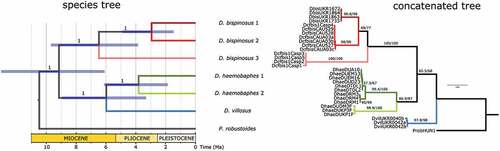
Table II. Results of Bayes factor species delimitation (BFD) based on Bayesian multilocus analysis of COI and 28S fragments
Figure 3. Distribution of D. bispinosus MOTUs: D. bispinosus 1 – red; D. bispinosus 2 – yellow; D. bispinosus 3 – blue.
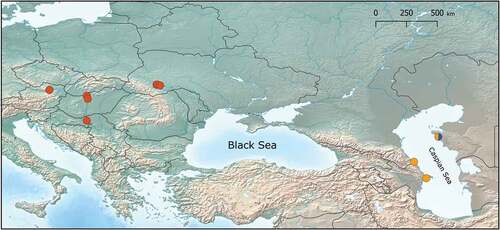
Table III. Estimates of evolutionary divergence between groups (mean p-distances) based on COI gene region (below diagonal) and 28S (above diagonal)
Figure 4. SEM pictures of antenna 2 and gnathopod 2 from D. bispinosus 1 (A, B), D. bispinosus 2 (C, D) and D. bispinosus 3 (E, F) respectively.