Figures & data
Table I. Body measurements for the E. sinensis populations (mean ± SD)
Figure 1. Schematic diagram of E. sinensis; Carapaces of a. male and b. female crabs; Abdomens of c. male and d. female crabs. e. Map of landmarks on the carapace of E. sinensis and schematic diagram of the scaling standard. A and B are the widest parts of the carapace. f. Map of landmarks on the carapace of E. sinensis.
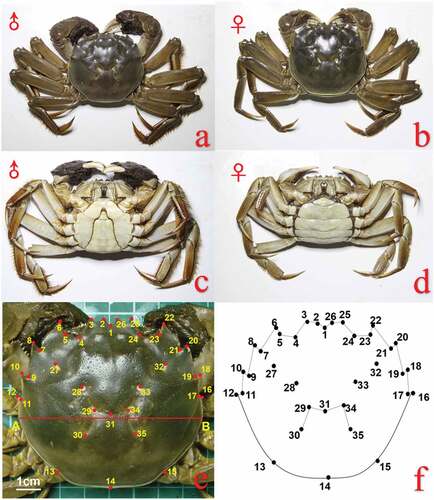
Figure 2. Principal component analysis of the carapace morphology of E. sinensis from Yangcheng Lake; Principal component analysis scatter plots of a. male and b. female E. sinensis; Comparison of extreme value shapes from negative to positive for c. male and d. female E. sinensis (variation is enlarged by three times). The red line is negative extreme value shapes, while the black line is positive extreme value shapes.
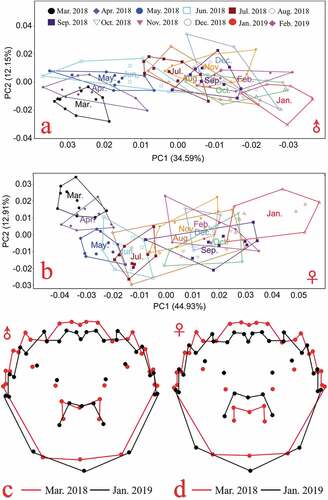
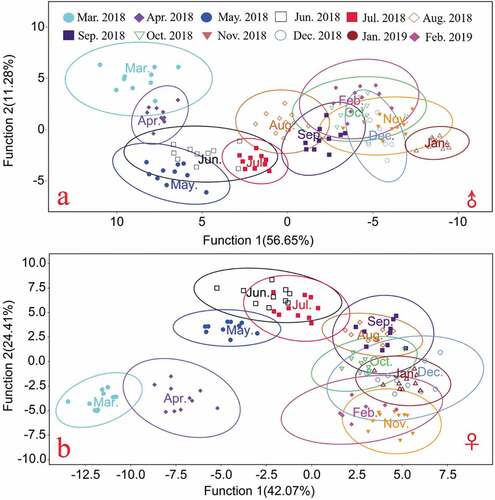
Figure 3. Discriminant analysis scatter plot of Yangcheng Lake E. sinensis based on carapace morphology (95% confidence interval for ellipses); a. Male crab; b. Female crab.