Figures & data
Figure 1. Study site, the estuary areas of the two largest rivers in Poland (Odra - Szczecin Lagoon) and the Vistula (Vistula Lagoon), and two dam reservoirs in southern Poland, from which part of Goosander stomach samples originated: Goczałkowice (left) and Dobczyce (right).
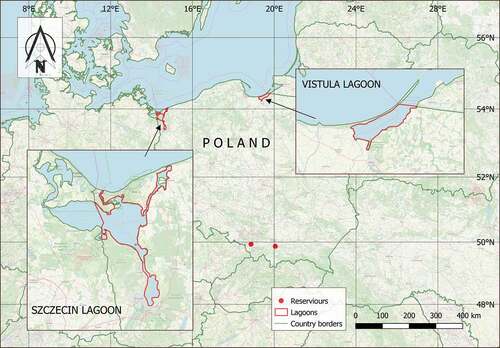
Figure 2. Species of fish, their length (A) and weight (B) (NFISH = 348) eaten by Goosander (NBIRDS = 23) wintering in Poland in 2010–2018. Black dots – outliers; grey dots – all data; line – median; whiskers – the highest and lowest values; box – interquartile range. See raw data for more details: S2_Goosander_stomach_analysis.csv at Marchowski, Dominik (Citation2021), “Goosander_vs_Fishermen”, Mendeley Data, V1, doi: 10.17632/fc2kscztmv.1.
Figure 3. The average numbers of Goosander Mergus merganser in southern Baltic lagoons in particular months in 2011–2018. OCT – October, NOV – November, JAN – January, MAR – March, APR – April, MAY-SEPT – period from May to September. Black dots – outliers; grey dots – all data; line – median; whiskers – the highest and lowest values; box – interquartile range.
Figure 4. Average yearly fish consumption by Goosander Mergus merganser wintering in the Baltic coastal lagoons and the estuaries of the two largest rivers in Poland (Vistula and Odra) in 2011–2018, broken down by fish species. PE – Perch Perca fluviatilis, RF – Ruffe Gymnocephalus cernua, RO – Roach Rutilus rutilus, ZA – Zander Sander lucioperca.
Figure 5. Fishing by fishermen and Goosander Mergus merganser in the lagoons of the southern Baltic in 2011–2018.
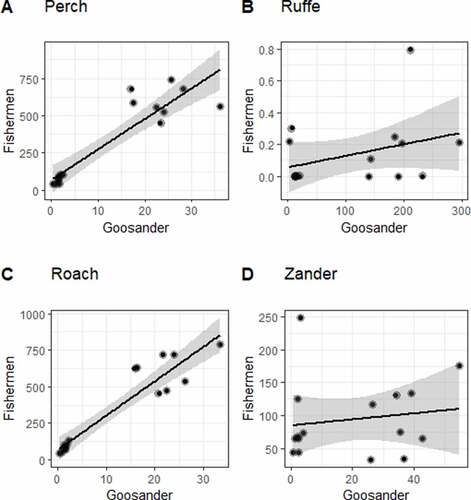
Figure 6. The impact of Goosander Mergus merganser foraging on fishermen’s catches in the lagoons of the southern Baltic (Poland) in 2011–2018 (NSEASONS = 8). Species from overlapping ecological niches are shown. Black dots - fish caught by Fishermen and Goosander in tons, black line - linear model fitted to the data, the grey area is the 95% confidence level interval for predictions from the linear model.