Figures & data
Figure 1. Map of Italian Peninsula and study area. Orange area represents Po Plain in its entirety. Red rectangle is the polygon extent of Po Plain with 10-km-buffer where Ecological Niche Models were performed.
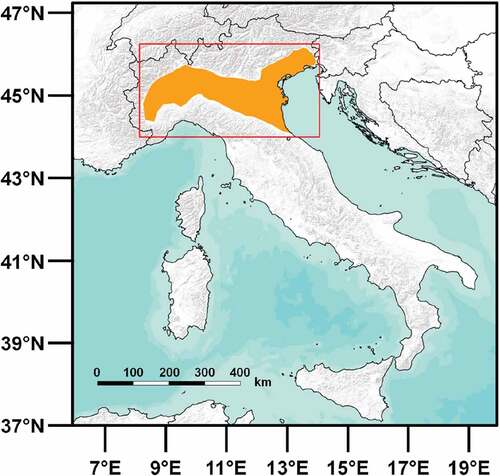
Figure 2. Environmental and climatic suitability of the Po Plain (Northern Italy) for the three Falco species that recently expanded in the area. a) lesser kestrel, b) red-footed falcon, c) common kestrel. Colour intensity is proportional to the suitability, ranging from 0 (pale red) to 1 (dark red). Dots represent the certain breeding occurrences recorded for each species and used to run the models.
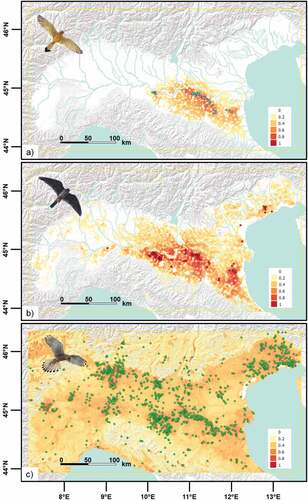
Table I. Contributions of each of the eco-climatic variables in the final ensemble models for each Falco species (different columns). The symbols in the brackets indicate the direction of the effect as derived by the observation of the loess (see ) expressing the relation between each variable and the suitability for the species: positive (+), negative (-), quadratic (±); i.e. with an optimum value;), very weak effect (0)
Figure 3. Response curves showing the average probability value of the ensemble model for each explanatory variable, for lesser kestrel (blue line), red-footed falcon (red line) and common kestrel (green line). The shades represent standard error bounds calculated with a t-based approximation.
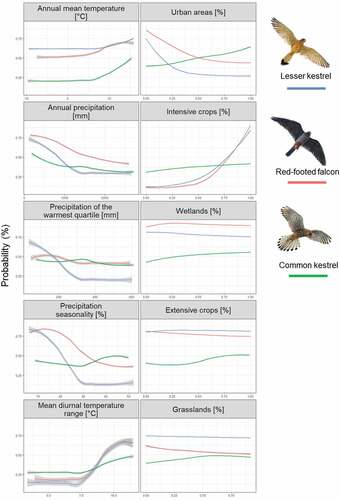
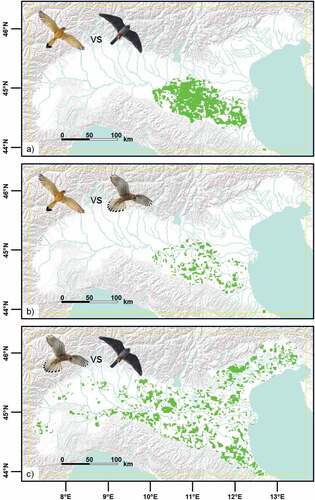
Figure 4. Correlation maps between species suitability: a) lesser kestrel vs red-footed falcon, b) common kestrel vs lesser kestrel, c) red-footed falcon vs common kestrel. Each map shows the statistically significant positive correlations areas (Pearson’s coefficient > 0.70).