
Figures & data
Figure 1. Scheme of experimental design.
Table I. HPLC-UV/DAD instrument conditions
Table II. The gradients of the eluents after the HPLC column was conditioned in the mobile phase for 1 h
Figure 2. A, B and C: Box-plots obtained using the Kruskal-Wallis test on the developed embryos and the unfertilised and degenerated eggs (from left to right). The circles represent the outlier; a, b, c: microscopic photographs of the embryos and the unfertilised and degenerated eggs. Scale bar 50 µm. The asterisks represent statistical differences (** p < 0.01, ***p < 0.001).
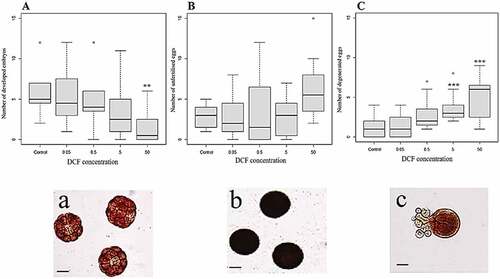
Figure 3. DCF accumulation in embryos. Values are expressed as the mean ± SD. The asterisks represent statistical differences (** p < 0.01).
Figure 4. DCF accumulation in A. lixula eggs (A) and sperm (B) measure by HPLC analysis. The circles represent the outlier. Significant accumulation were observed at concentrations over 50 mg/L. The asterisks represent statistical differences (***p < 0.001).
Table III. Concentrations of DCF absorbed in the sperm and egg samples, expressed as the mean ± standard deviation