Figures & data
Table I. Concentrations of heavy metals in living organisms of the Baltic Sea
Table II. Concentrations of heavy metals (in µg/g d.w.) in surface sediments from the Gulf of Gdańsk and from the Polish part of the Baltic Sea (Szefer et al. Citation2009)
Figure 1. Study areas. Wintering population of the mute swan (Cygnus olor) in Słupsk, Gdynia, and Sopot (northern Poland).
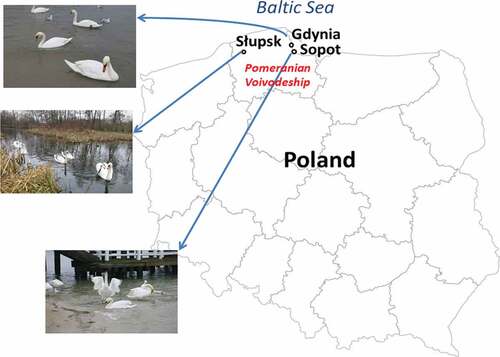
Figure 2. Study flow chart.
Table III. Analysis of variance for significance of the concentrations of metals in soil samples collected from the different areas (Słupsk, Gdynia, and Sopot) of the Pomeranian region, northern Poland
Table IV. Mean concentrations of elements (mg/kg) ± standard deviations in soil samples collected from the Słupsk, Sopot and Gdynia (Pomeranian region, northern Poland) habitat of the mute swan populations
Table V. Multivariate significance tests and effective hypothesis decomposition for the element contents in the feathers of mute swans of different ages and sex collected from three different habitats in the Pomeranian region, northern Poland
Table VI. Analysis of variance of the impact of the main effects on the element contents in the feathers of mute swans living in the different localizations (Słupsk, Gdynia, and Sopot)
Table VII. Analysis of variance of the impact of the main effects on the element contents in mute swans of different ages (juveniles and adults)
Table VIII. Analysis of variance of the impact of the main effects on the element contents in mute swans of different sex (males and females)
Table IX. Mean concentrations of elements (mg/kg) ± standard deviations in the feathers of mute swans of different ages (Juveniles, n = 10; adults, n = 12) and sex (males, n = 10, females, n = 9) living in Sopot, Gdynia and Słupsk (Pomeranian region, northern Poland)
Figure 3. Levels of diene conjugates (A, nmol∙mL−1) and middle-mass molecules (B, U∙L−1) in the blood of mute swans of different ages and sexes inhabiting Słupsk, Sopot, and Gdynia (northern Poland).
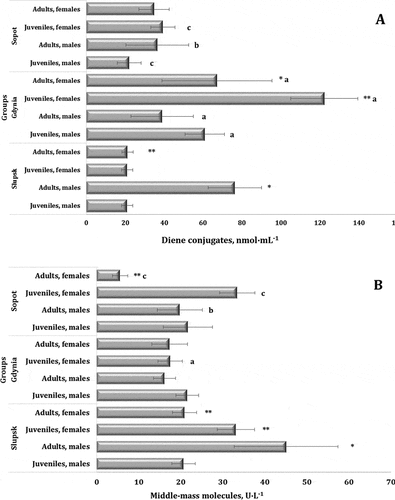
Figure 4. Activities of superoxide dismutase (A, U∙mL−1) and catalase (B, μmol H2O2∙min−1∙mL−1) in the blood of mute swans of different ages and sexes inhabiting Słupsk, Gdynia, and Sopot (northern Poland).
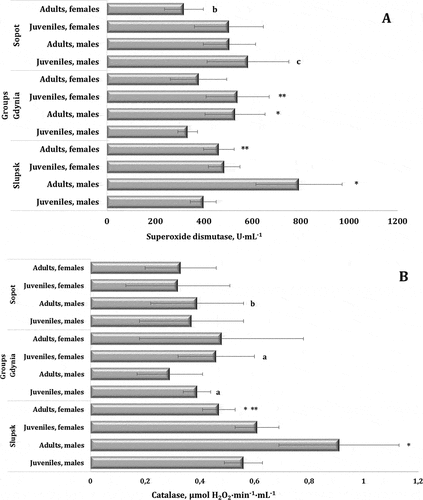
Figure 5. Activities of glutathione reductase (A, U∙mL−1) and glutathione peroxidase (B, U∙mL−1) in the blood of mute swans of different ages and sexes inhabiting Słupsk, Gdynia, and Sopot (northern Poland, Pomeranian region).
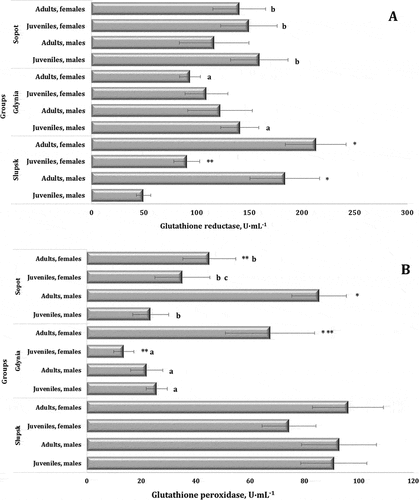
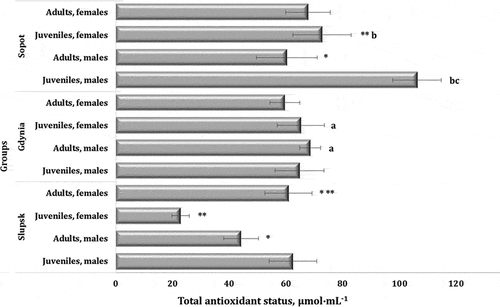
Figure 6. Level of total antioxidant status (TAS, μmol∙mL−1) in the blood of mute swans of different ages and sexes inhabiting Słupsk, Gdynia, and Sopot (northern Poland, Pomeranian region).