Figures & data
Figure 1. The accumulation of Pb in Anabas testudineus tissues during exposure period (Mean ± SD, n = 3 and *significantly different (p < 0.05) between Pb-exposed fish and control fish).
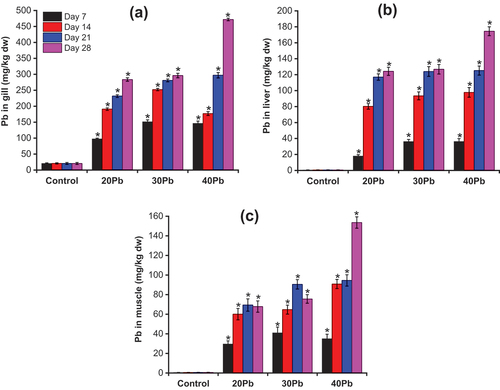
Figure 2. The accumulation of Cd in Anabas testudineus tissues during exposure period (Mean ± SD, n = 3 and *significantly different (p < 0.05) between Cd-exposed fish and control fish).
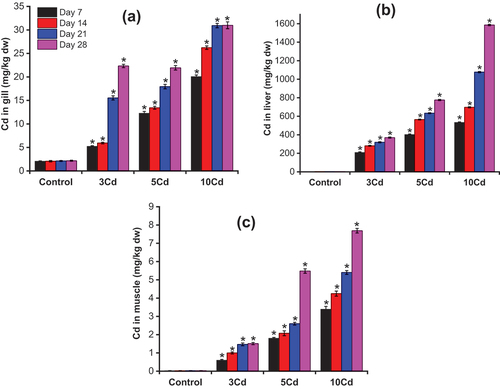
Figure 3. (a) and (c) The changes in plasma cortisol in Anabas testudineus on exposure to Pb and Cd, respectively; (b) and (d) the increase in plasma cortisol in Anabas testudineus between Pb-exposed or Cd-exposed fish and control fish (Mean ± SD, n = 3 and *significantly difference (p < 0.05) between Pb-exposed or Cd-exposed fish and control fish).
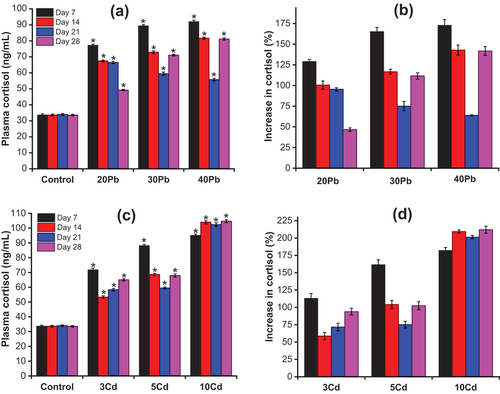
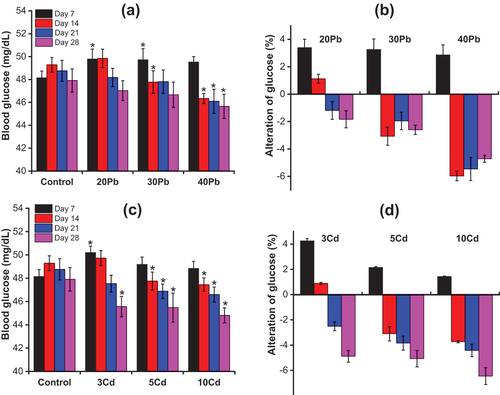
Figure 4. (a) and (c) The changes in blood glucose in Anabas testudineus on exposure to Pb and Cd, respectively; (b) and (d) The alteration of blood glucose in Anabas testudineus between Pb-exposed or Cd-exposed fish and control fish (Mean ± SD, n = 3 and *significantly difference (p < 0.05) between Pb-exposed or Cd-exposed fish and control fish).