
Figures & data
Figure 1. Breeding range of Lanius senator. Coloured areas delimit the distribution of subspecies L. s. senator, L. s. badius, L. s. niloticus, as shown in the legend. Black dots define the samples size for each locality (specific details on sampling sites are reported in & Figure S2). Wintering range is not shown, although we included a Genbank sequence from Gambia in the analysis. The map was made with QGIS 3.16.10 (https://qgis.org) and it was based on BirdLife international and Handbook of the Birds of the World (2020).
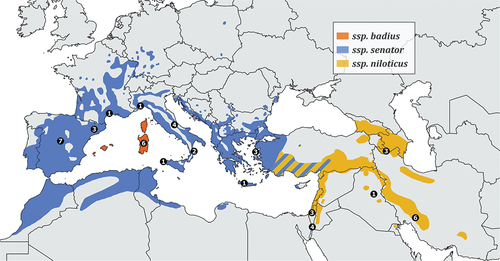
Table I. List of specimens investigated in this study with voucher/accession number, subspecies, sex, sampling locality and origin.
Figure 2. Haplotype median-joining networks of the concatenated mtDNA dataset. (a) shows haplotypes network based on putative subspecies designations (see inset), while (b) is based on sampling locality (see inset).
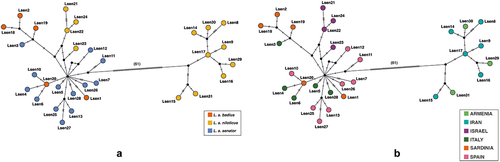
Figure 3. Bayesian Inference and Neighbor-Joining phylogenetic tree of the concatenated mtDNA haplotypes. Numbers on the nodes refer to BI posterior probabilities (left) and to bootstrap support values of the NJ analysis (right) using the p-distance substitution model. Thresholds for both BI posterior probabilities and bootstrap support values were set at ≥50%; dashes represent values below that threshold. The colours shown here mimic those used in , such that the orange-blue background corresponds to the badius/senator (BS) haplogroup, while the yellow background represents the niloticus (N) haplogroup. Squares to the right of each individual define the putative subspecies attributed to the individual, based on geography and morphology.
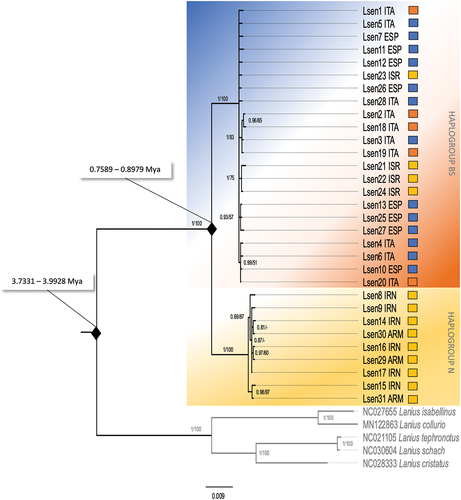
Table II. Genetic distances (p-distance) dataset between and within different groups: within Lanius senator, between and within L. senator haplogroups N and L. senator haplogroups BS; Lanius spp. (excluding L. senator). Distances were estimated for all the mtDNA loci dataset (Table S4). Column S(n) includes the number of considered group/species and, within brackets, the overall number of considered sequences.
Table III. Genetic diversity indices calculated on mtDNA loci, concatenated mtDNA dataset, and nuDNA loci. * (p < 0.05), ** (p < 0.01).
Supplemental Material
Download MS Excel (282.7 KB)Supplemental Material
Download MS Excel (26.4 KB)Supplemental Material
Download MS Excel (16.8 KB)Supplemental Material
Download MS Excel (90.5 KB)Supplemental Material
Download MS Excel (17.3 KB)Supplemental Material Figures
Download PDF (4.1 MB)Data availability statement
All specimen data are accessible on GenBank (Accession numbers OD991865-OD992005).