
Figures & data
Figure 1. Flow diagram of article selection.
Table I. Characteristics of included studies.
Figure 2. Forest plot of rates of Cheyletus in all mites from dust. ES is abbreviation of effect size and means distribution rate (%).
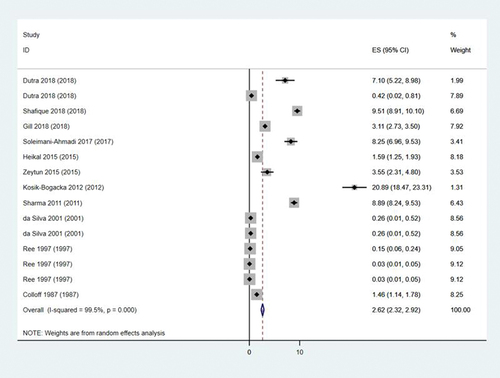
Figure 3. Forest plot rates of dust samples with Cheyletus in all dust samples. ES is abbreviation of effect size and means distribution rate (%).
Table II. Results of subgroup analysis of distribution rates.
Figure 4. Forest plot of subgroup analysis by year of publication. ES is abbreviation of effect size and means distribution rate (%).
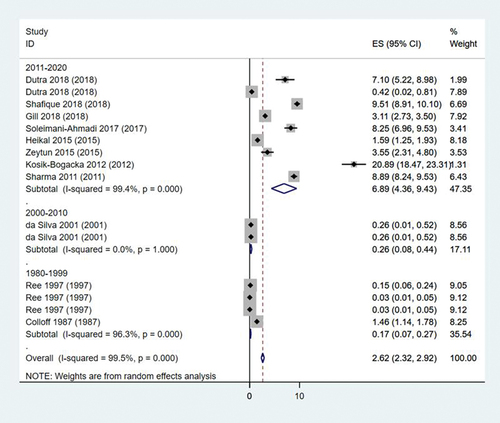
Figure 5. Sensitivity analysis by omitting studies one by one.
