Figures & data
Figure 1. Species identification: morphological and molecular identification. (a) The region of scorpions collected. The place marked by red is Shandong Province, China, where the samples were collected. (b) The morphological character of samples with different gender. (c) Pliers’ length distribution. (d) Body length distribution. (e) Trunk width distribution. (f) Teeth number distribution. (g) Telson length distribution. (h) Telson width distribution. (i) Phylogenetic tree constructed using mtDNA sequences of COI by using MEGA 7 with the Neighbor-Joining method. The sequencing TRINITY_DN28461_c1_g1 is marked with red circles and the arthropod are marked with yellow circles. The identity values are indicated on the right of each species name. (k) Phylogenetic tree constructed using the COI amino acid sequences of TRINITY_DN28461_c1_g1 and 6 other species using MEGA 7 with the Neighbor-Joining method. The sequencing TRINITY_DN28461_c1_g1 is marked with red circles and the arthropod are marked with yellow circles. The identity values are indicated to the right of each species name.
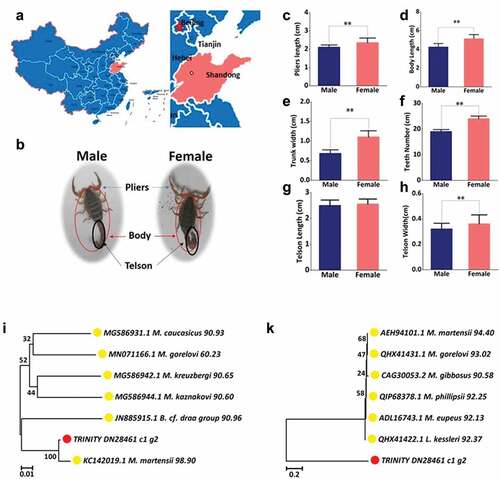
Figure 2. Toxin activity. (a) Blood biochemical indexes, (b) Survival curve of mice, (c) The effects of male and female scorpion venom of Mesobuthus martensii on heart, liver, and kidney.
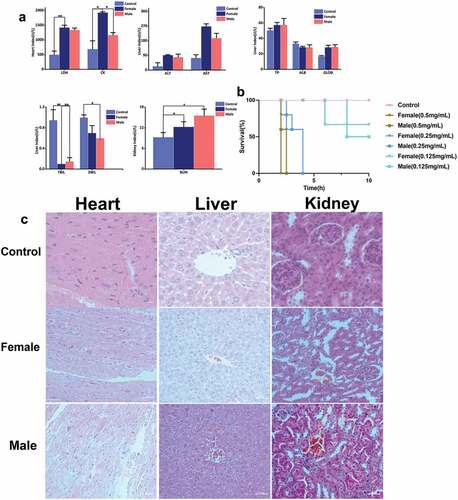
Figure 3. Quality control and overview of the transcriptome. (a) Number of unigenes and unigenes annotated in GO, KEGG, Pfam, Swissprot, eggNOG and NR database, (b) Length distribution of unigenes, (c) GC content distribution of unigenes. The abscissa of B and C are the unit of measurement. The primary ordinate of B and C correspond to the histogram representing the number of unigenes, while the secondary ordinate represent the cumulative percentage, (d) The number of up and down regulated unigenes with female vs. male, (e) Volcanic plot of differentially expressed unigenes, the abscissa represents log2 (fold change) (indicates the relative change trend) and the ordinate represents –log FDR (the negative logarithmic form of FDR represents the differential expression of genes, which can be well displayed on the ordinate). Each dot represents a unigenes, the red dot represents the up-regulated unigenes while the blue dot represents the down-regulated unigenes, and the grey dot represents the unigenes without significant difference, (f) Cluster heat map of the annotated unigenes. F1, F2, F3 and F4 represent the four groups of female scorpions and M1, M2, M3 and M4 represent the four male groups of scorpions.
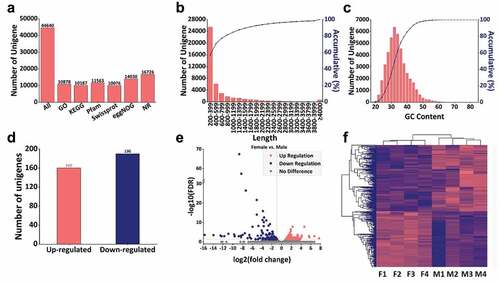
Table I. Overview of the sequencing quality control.
Figure 4. Gene Ontology (GO) analysis. (a)The top ten results of three GO terms: biological process (BP), cell composition (CC) and molecular function (MF). The abscissa is the annotated terms. The main ordinate corresponds to the histogram that indicates the ratio of unigenes in each term to the total unigenes identified, while the sub-ordinate represents the value of ratio folds in female vs. male. The word “ratio” means the ratio of proportion of annotated unigenes in female scorpions to the proportion of annotated unigenes in male scorpions in a certain term.
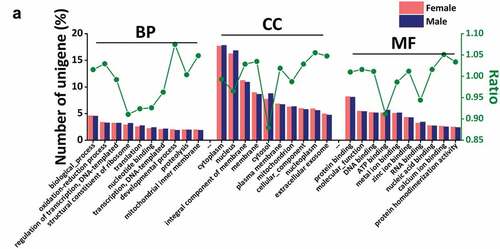
Figure 5. KEGG analysis. (a) The annotated results of KEGG database in level 1, (b) Metabolism gene enrichment, Genetic information processing gene enrichment, Environmental information processing gene enrichment, Cellular Processes gene enrichment, Organism System gene enrichment, Human disease gene enrichment, (c) “Lysine degradation”, “oxidative phosphorylation” and “protein processing in the endoplasmic reticulum” gene enrichment. (Abscissa: functional annotation; ordinate: ratio of the proportion of annotated unigenes in female scorpions to the proportion of annotated unigenes in male scorpions).
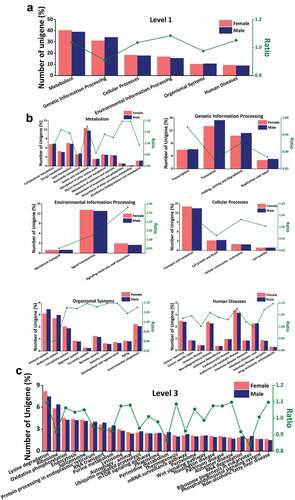
Figure 6. Toxins screening of scorpion. (a) The screened toxins in the transcriptome of collected male and female Mesobuthus martensii. Different colors represent different toxins, and different sizes represent the number of each toxin, (b) Volcanic map of the screened female scorpion toxin, (c) Volcanic map of the screened male scorpion toxin. The abscissas of B and C represent log2 (fold change) and the ordinate represents -log10 (P-value). Each dot represents a toxin unigenes, the red dot represents the up-regulated toxins while the blue dot represents the down-regulated toxins, and the grey dot represents the toxins without significant difference, (d) Cluster heat map of the annotated unigenes. F1, F2, F3 and F4 represent the four groups of female scorpions and M1, M2, M3 and M4 represent the four male groups of scorpions.
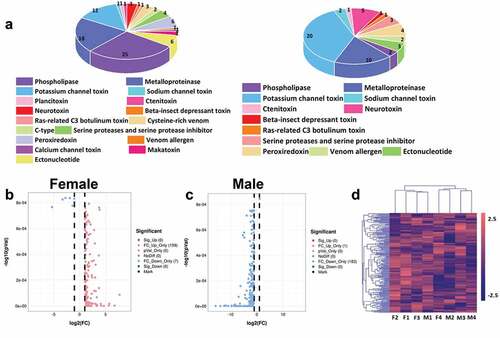
Figure 7. Structure analysis including sequence alignment, 3D modeling and phylogenetic analysis of makatoxin-2. (a) A putative sequences TRINITY_DN28041_c0_g1 was aligned with a model Makatoxin-2 (pdb ID: 2KBK). At the bottom of columns, asterisks (*) show conserved positions, colons (:) show conserved substitutions and points (.) show non-conserved substitutions. Grey line, green Bend, blue banded arrowhead, and red solenoid represent coil, turn, sheet and helix, respectively. Different fragments are framed by red lines, (b) 3D modeling was simulated using the template Makatoxin-2 (PDB ID: 2KBK) by Swiss-MODEL and viewed by Discovery Studio 4.5. The colors grey, green, blue, and red represent coils, turns, sheets and helices, respectively, (c) Phylogenetic tree constructed using TRINITY_DN28041_c0_g1 and 10 other sequences from different species using MEGA 7 with the Neighbor-Joining method. TRINITY_DN28041_c0_g1 was marked in red circle and the arthropod was marked in yellow circle.
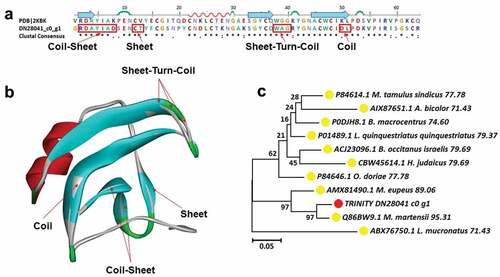
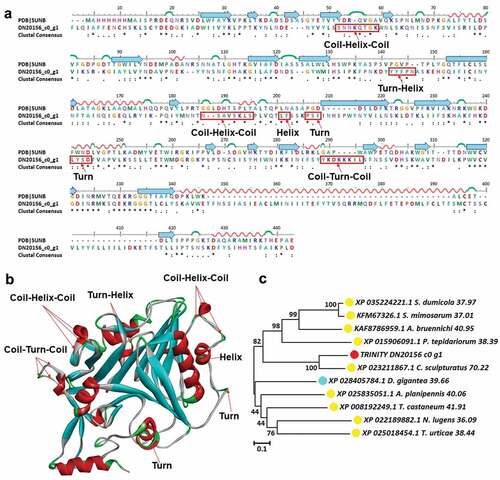
Figure 8. Structure analysis including sequence alignment, 3D modeling and phylogenetic analysis of plancitoxin-1-like isoform X1. (a) A putative sequences TRINITY_DN20156_c0_g1 was aligned with a model plancitoxin-1-like isoform X1 (PDB ID: 5UNB). At the bottom of columns, asterisks (*) show conserved positions, colons (:) show conserved substitutions and points (.) show non-conserved substitutions. Grey line, green Bend, blue banded arrowhead, and red solenoid represent coil, turn, sheet and helix, respectively. Different fragments are framed by red lines, (b) 3D modeling was simulated using the template plancitoxin-1-like isoform X1 (PDB ID: 5UNB) by Swiss-MODEL and viewed by Discovery Studio 4.5. The colors grey, green, blue, and red represent coils, turns, sheets and helices, respectively, (c) Phylogenetic tree constructed using TRINITY_DN20156_c0_g1 and 10 other sequences from different species using MEGA 7 with the Neighbor-Joining method. TRINITY_DN20156_c0_g1 was marked in red circle, the arthropod was marked in yellow circle and the cnidarian was marked in blue circle.