Figures & data
Figure 1. Population density (people per square kilometer) and sampling sites.
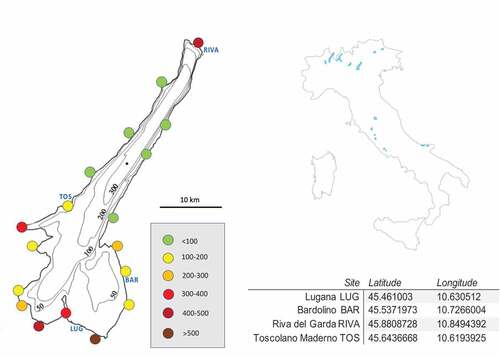
Figure 2. Cryptorchestia garbinii, above a male specimen, below a female.
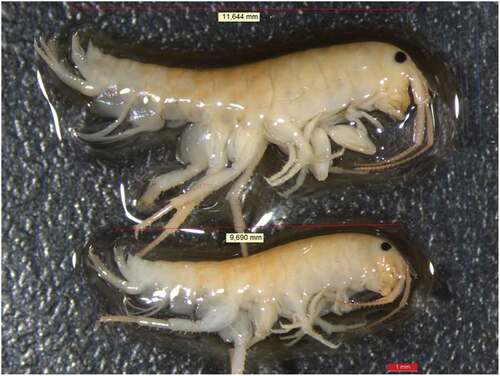
Figure 3. Microscope images of microplastics on a filter stained with Nile red, in green fluorescence (ex. 450–490; em 515–565 nm) (left) and brightfield (right), with measurements.
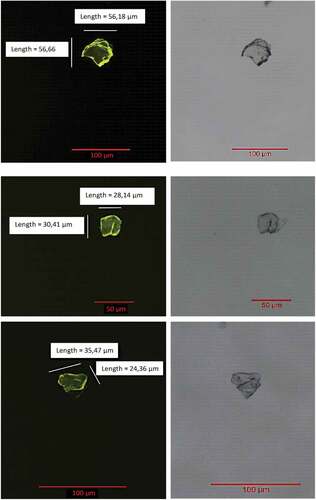
Figure 4. Size categories of microplastics ingested by Cryptorchestia garbinii in all sites.
Table I. Microplastic particles size measured in μm as length (the longest dimension) and width (perpendicular to the length).
Figure 5. Images of fiber observed on a filter stained with Nile red, in green fluorescence (ex. 450–490; em 515–565 nm) (left) and brightfield (right).
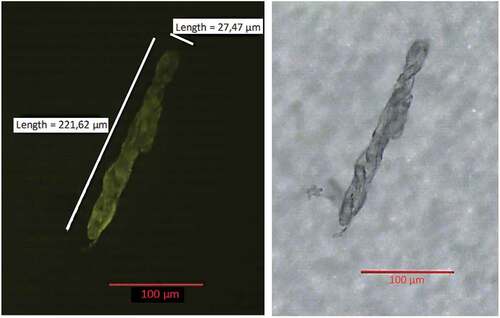
Figure 6. a Fibers’ abundance per site; b Percentage of fibers per site on the total detected.
Figure 7. Average number of MPs ingested per specimen (± standard error) by sampling site. Different letters indicate significant differences according to t test (P ≤ 0.05).