
Figures & data
Table I. Air temperature (°C) and total rainfall (mm) in Trento and Rovereto in 2001–2009 and 2010–2020. “Summer” refers to the period from 21 June to 21 September; “active traps” to the period from May to October.
Figure 1. Study area. White circles = ovitrap sites in Trento and Rovereto (Trentino Province, north-eastern Italy). Trento: 46°04′N, 11°07′E; 194 m a.s.l.; Rovereto: 45°53′00″N, 11°02′03″E; 204 m a.s.l.
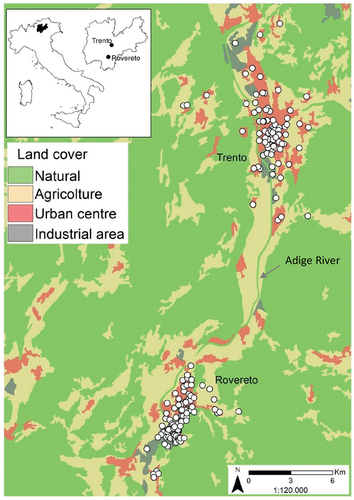
Figure 2. (a) Boxplot of the average number of eggs in the two cities, period from May to September, 2010 to 2020. The number of eggs is significantly different because the two boxes do not overlap. Box represents the first interquartile range, the line is the median, the whiskers are the third interquartile range. (b) Trends of the average number of eggs in Rovereto (from 2001 to 2020) and Trento (2010–2020).
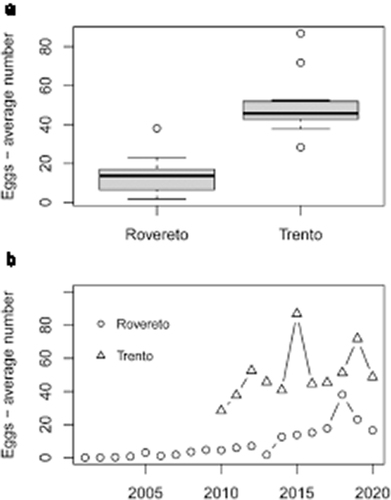
Table II. Number of activated ovitraps across the years classified according to the features of the neighbouring areas.
Figure 3. Egg abundance in the different habitat categories where ovitraps were placed in Rovereto (a) and Trento (b). Box represents the first interquartile range, the line is the median, the whiskers are the third interquartile range. * = p < 0.01, ** = p < 0.001.
Table III. Results of the linear model between number of eggs and temperature in the two cities. SE = standard error, df = degrees of freedom.
Figure 4. Relationship between weekly average number of eggs and temperature in the two cities.
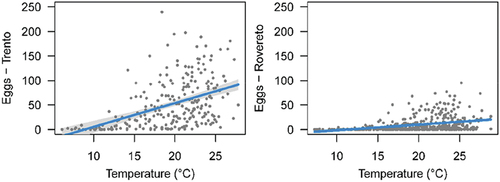
Figure 5. Average yearly temperatures (daily averages in the period of activated traps) in the two cities.
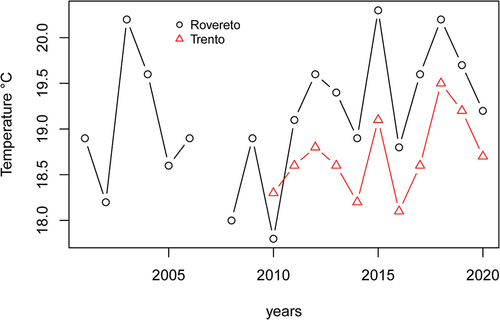
Figure 6. Number of eggs (median across ovitraps) and temperature measured in the two cities. The female adults start laying eggs when temperature is 12.5–13.5°C, with few cases when it is colder.
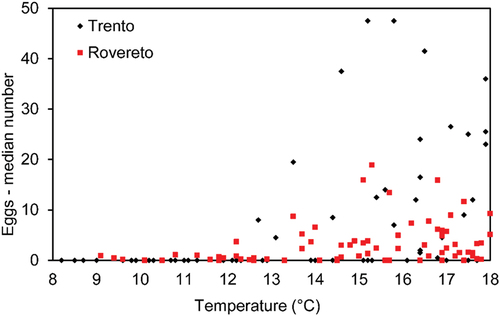
Table IV. Week numbers when the peak of temperature and eggs occurred in the years. For example, in 2010 the peak of temperature occurred at the 27th week whereas that of eggs at 35th week; the lag between the peak of temperature and eggs was 8.1 weeks.
Figure 7. Visualisation of the delay between temperature peak and eggs peak in a typical year (2019, Trento). Data for all the years and in both cities are presented in . Relationship between week number and (a) average daily temperature and (b) average number of eggs among 2019’s ovitraps. Hierarchical logistic regression model using a skewed response curve (model V of the HOF models).
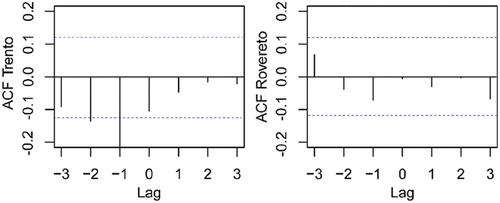
Figure 8. Cross correlation between weekly average number of eggs and weekly rainfall in Trento and Rovereto. Dashed line indicates the 5% significance level. ACF = autocorrelation function.
Data availability statement
The data presented in this study (if not included in the Supplementary Material) are available on request from the corresponding author. The data of egg abundance are of jointed property with funders.