
Figures & data
Figure 1. The system comprised of two identical non-transparent vertical columns (a) and the light intensity (b), temperature (c) and oxygen concentration (d) gradients in the control (dotted line, mean + 1 SD) and experimental treatments (solid line, mean _ 1 SD).
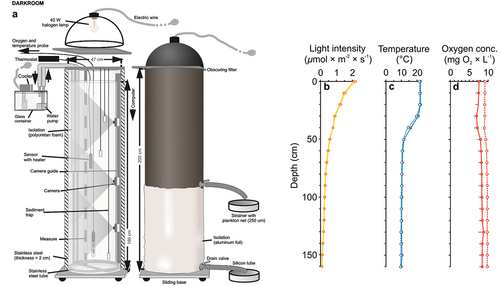
Figure 2. Relative concentration (%) of large (a) and small (b) MPs in the water column in the control (filled box, mean + 1 SD) and experimental conditions (empty box, mean _ 1 SD) and the number of large (c) and small (d) MPs in sediment traps in the control (dotted line, mean _ 1 SD) and experimental conditions (solid line, mean + 1 SD).
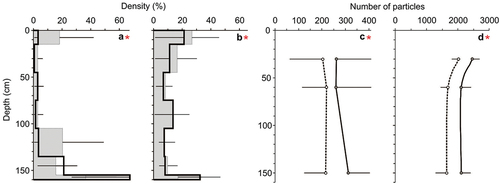
Table I. The results of the analysis of deviance (Type II Wald chi-square tests for model-fixed effects) of the generalised linear mixed effects model (GLME) to test the effect of experimental condition (Tr), depth (Dp), MP size (Size), the Tr × Dp, Tr × Size, Dp × Size and Tr × Dp × Size interactions on the distribution in water column and sedimentation rate of (MPs). The χ2 is Chi-squared statistic associated with a P-value (Pr(> χ2)). Statistically significant differences are marked in bold (df – degree of freedom).
Table II. The results of the two-way mixed ANOVA for trimmed means to test the effect of the presence of fish on the bacterial abundances with treatment (Tr) as between observations factor and depth (Dp) as within observations factors. Statistically significant differences are marked in bold (df – degree of freedom, Q – Q statistics, P corr. – p-value corrected).
Table III. The results of the two-way mixed ANOVA for trimmed means to test the effect of the presence of fish on the DW distribution in the water column and the DW sedimentation rate with treatment (Tr) as between observation factor and depth (Dp) as within observation factors. Statistically significant differences are marked in bold (df – degree of freedom, Q – Q statistics, P corr. – p-value corrected).
Figure 3. Distribution (a) and sedimentation rate (b) of DW in the control (dotted line, mean _ 1 SD) and experimental treatment (solid line, mean + 1 SD) and the relative distribution of fish (mean ± 1 SD, %) before (c) and after (d) the feeding session.
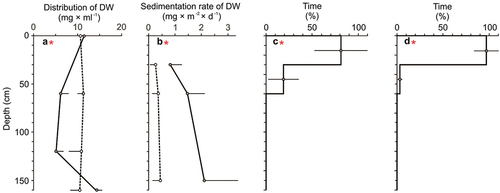
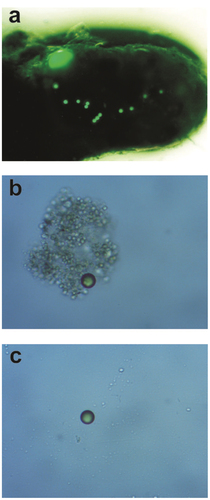
Figure 4. Fish faecal pellet with a single large particle and a few small MPs extracted from the sediment trap in the experimental treatment photographed under the UV microscope (Nikon Eclipse E450) with 4 × magnification (a) and a single particle of MPs extracted from the water in the experimental treatment (b) and in control (c) photographed by the UV microscope (Nikon Eclipse E450) with 8 × magnification.
Supplemental Material
Download MS Word (36.8 KB)Data availability statement
The data presented in this study are available on request from the corresponding author.