Figures & data
Figure 1. Location of the surveyed reaches considered in the study. Surveyed stream reaches: 1 = Belbo River; 2–3 = Ghiandone River; 4 = Orco River; 5 = Pellice River.
Table I. Name, location, characteristics and morphological classification of surveyed reaches. River morphology codes (according to Gurnell et al. Citation2014): C = confined; P = partly confined; U = unconfined; SS = straight-sinuous; M = meandering; S = sinuous; PM = pseudo-meandering. Reach width represents the mean value of the active river channel width in each surveyed reach.
Table II. The physical habitat attributes of the MesoHABSIM approach used to describe the hydro-morphological units (HMUs) in the surveyed reaches. For each habitat parameter the corresponding categories are expressed as reported in Vezza et al. (Citation2014, Citation2017).
Figure 2. (a) Sampling station, Ghiandone River (NW Italy); (b) sediment cores; (c) Bertel mechanical sieve; (d) samples of the five granulometric classes considered.
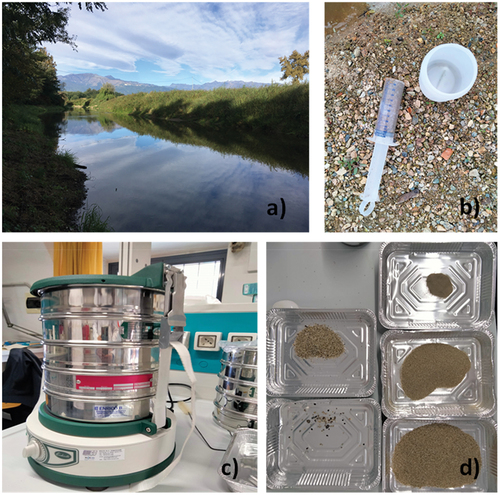
Figure 3. Lampetra zanandreai ammocoetes RF model. Selected physical attributes (in order of importance) for the oversampled parsimonious model. The relationship between variables and probability of presence is reported using partial dependence plots (PDPs).
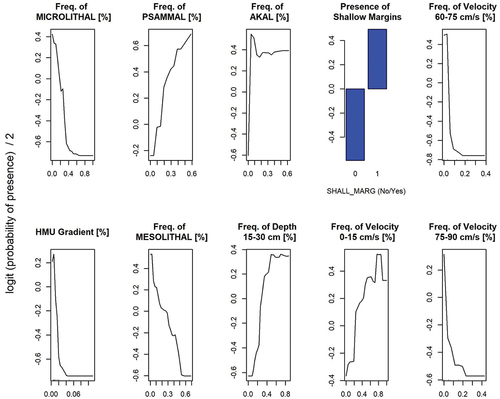
Table III. Correlations between volume and mass of the different granulometric size classes.
Figure 4. Mean mass percentage of the five granulometric classes in the 25 samples considered.
Figure 5. Principal component analysis ordination plot. Labels indicate granulometric classes; dots represent sample cores.