Figures & data
Figure 1. Sampling sites on the Tolfa Mountains (Rome, Latium, Italy). Orange dots indicate the location of the four sites (A, B, C, D). Each yellow dot indicates a pair of funnel traps (CTD-baited trap and control trap), two pairs of traps for each site were set (about 30 m apart). All the images are north-oriented. Satellite images were taken from Google Earth Pro.
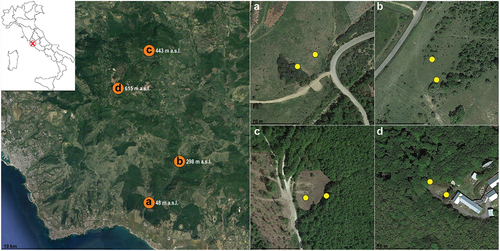
Table I. Checklist of Meloidae and Oedemeridae (in alphabetical order) recorded from Tolfa Mountains and close area (Latium, Italy) with the roughly phenology of adults. Species are proposed as putative natural sources of CTD for canthariphilous species. Diversity (H) and evenness (E) indices for canthariphilous species are reported at the top of the table for each sampling date. Table is divided and coloured as in to facilitate comparison.
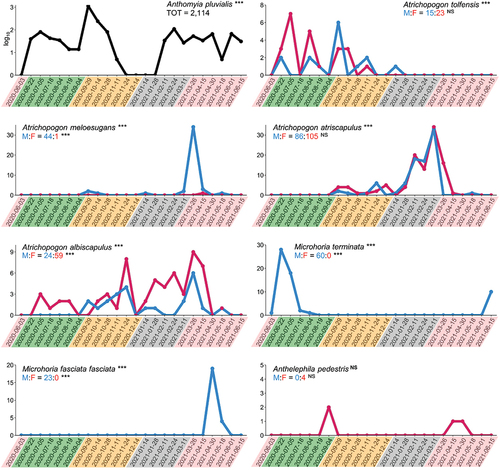
Figure 2. Total number of individuals collected for each species in CTD-baited traps during the one-year sampling on the Tolfa Mountains. Logarithmic scale (log10) is used for individuals of Anthomyia pluvialis (Anthomyiidae, Diptera) due to the broad range of variation. Male/female ratio is given for species belonging to Ceratopogonidae (Diptera) and Anthicidae (Coleoptera). Sampling dates are coloured to highlight the seasons (pink, spring; green, summer; yellow, autumn; grey, winter). Binomial test was used to test the occurrence in CTD-baited traps vs. control traps and differences in attraction between males and females. X-axis, sampling date (24 hours); y-axis, number of individuals; M, males (blue); F, females (purple); NS, p-value > 0.05; asterisks (***), p-value < 0.001.