Figures & data
Figure 1. Localization of granulocytes in the hemocoel of Steatoda grossa during the short-term experiment. (a) Control animals (CT). Scale bar = 12 µm. (b) CT_PMA experimental group. Scale bar = 10 µm. (c) Cd experimental group. Scale bar = 12 µm. (d) Cd_PMA experimental group. Scale bar = 10 µm. (e) Cu experimental group. Scale bar = 13 µm. (f) Cu_PMA experimental group. Scale bar = 10 µm. Hemolymph (h), prohemocytes (1), plasmatocytes (2), granulocytes (3). Light microscope.
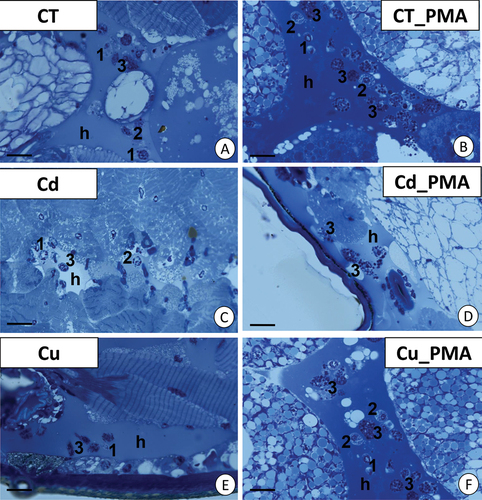
Figure 2. TEM images of granulocytes of adult specimens of Steatoda grossa from the control experimental groups: CT (a, b) and CT_PMA (c–e). Nuclei (n), granules of different electron densities (g), mitochondria (black arrows), glycogen granules (black circles), vacuoles (v), cisterns of the endoplasmic reticulum (ER). TEM. (a) Scale bar = 1.3 µm. (b) Scale bar = 1.2 µm. (c) Scale bar = 1.4 µm. (d) Scale bar = 1.2 µm. (e) Scale bar = 1.2 µm.
Figure 3. Short-term experiment. TEM images of granulocytes of adult specimens of Steatoda grossa from the Cd (a–d) and Cd_PMA (e–g) experimental groups. Nuclei (n), granules of different electron densities (g), mitochondria (black arrows), vacuoles (v), cisterns of the endoplasmic reticulum (ER). TEM. (a) Scale bar = 1.3 µm. (b) Scale bar = 1.4 µm. (c) Scale bar = 1.6 µm. (d) Scale bar = 1.3 µm. (e) Scale bar = 1.2 µm. (f) Scale bar = 1.4 µm. (g) Scale bar = 1.6 µm.
Figure 4. Short-term experiment. TEM images of granulocytes of adult specimens of Steatoda grossa from the Cu (a, b) and Cu_PMA (c, d) experimental groups. Nuclei (n), granules of different electron densities (g), mitochondria (black arrows), glycogen granules (black circles), vacuoles (v), cisterns of the endoplasmic reticulum (ER). TEM. (a) Scale bar = 1.4 µm. (b) Scale bar = 1.2 µm. (c) Scale bar = 1.2 µm. (d) Scale bar = 1.4 µm.
Figure 5. Long-term experiment. TEM images of granulocytes of adult specimens of Steatoda grossa from the Cd (a, b) and Cd_PMA (c, d) experimental groups. Nuclei (n), granules of different electron densities (g), mitochondria (black arrows), vacuoles (v), cisterns of the endoplasmic reticulum (ER), and glycogen granules (black circles). TEM. (a) Scale bar = 1.5 µm. (b) Scale bar = 1.2 µm. (c) Scale bar = 1.2 µm. (d) Scale bar = 0.8 µm.
Figure 6. Long-term experiment. TEM images of granulocytes of adult specimens of Steatoda grossa from the Cu (a, b) and Cu_PMA (c, d) experimental groups. Nuclei (n), granules of different electron densities (g), mitochondria (black arrows), cisterns of the endoplasmic reticulum (ER). TEM. (a) Scale bar = 1.2 µm. (b) Scale bar = 0.9 µm. (c) Scale bar = 1.2 µm. (d) Scale bar = 0.8 µm.
Figure 7. 3D representation of lysosomes and autolysosomes accumulation (red signals) in hemocytes of all experimental groups. Nuclei (blue signals). LysoTracker Red and DAPI staining, confocal microscopy. Scale bar = 10 µm.
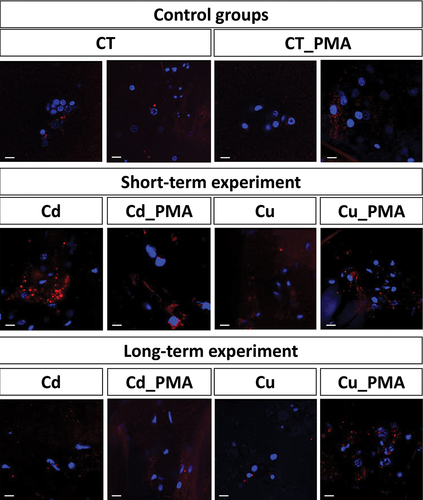
Table I. Analysis of variance (ANOVA/MANOVA) for examined parameters in the hemolymph of S. grossa spiders, considering metal exposure, time exposition on metals, and immunostimulation (PMA) as categorical factors (p < 0.05).
Figure 8. Percentage of early apoptotic cells (a), late apoptotic cells (b), and necrotic cells (c) in the hemolymph of Steatoda grossa in control group (CT) exposed to metals (Cu_int, Cd_int) and immunostimulant (PMA). Different letters (a, b) indicate significant differences between immunostimulated (PMA) and non-immunostimulated (NS) experimental groups within main groups (CT, Cu-int, and Cd-int); * indicates significant differences between CT group and Cu_int/Cd_int within NS or PMA groups; a, b indicate significant differences between short-term and long-term exposition within each metal groups and subgroups: NS or PMA; The Mann–Whitney U test (Median and quartile deviation: 25th and 75th percentiles; Q25 and Q75) of the analyzed parameters; p < 0.05); n = 3–7.
Figure 9. Concentrations of ATP (a) and rate of ADP/ATP (b) in the hemolymph of Steatoda grossa in control group (CT) exposed to metals (Cu_int, Cd_int) and immunostimulant (PMA). a, b indicate significant differences between short-term and long-term exposition within each metal groups and subgroups: NS or PMA; The Mann–Whitney U test (Median and quartile deviation: 25th and 75th percentiles; Q25 and Q75) of the analyzed parameters; p < 0.05); n = 3–7.
Figure 10. Activity of superoxidae dismutase (SOD; a), catalase (CAT; b) and Total antioxidant capacity (TAC; c) in the hemolymph of Steatoda grossa in control group (CT) exposed to metals (Cu_int, Cd_int) and immunostimulant (PMA). Different letters (a, b) indicate significant differences between immunostimulated (PMA) and non-immunostimulated (NS) experimental groups within main groups (CT, Cu-int, and Cd-int); * indicates significant differences between CT group and Cu_int/Cd_int within NS or PMA groups; a, b indicate significant differences between short-term and long-term exposition within each metal groups and subgroups: NS or PMA; The Mann–Whitney U test (Median and quartile deviation: 25th and 75th percentiles; Q25 and Q75) of the analyzed parameters; p < 0.05); n = 3–7.