
Figures & data
Figure 1. The study site of P. mnemosyne in the Narew river (NE Poland): a view at the peak of the flight period in late May (on the left) and in late April i.e. when most caterpillars complete their development (on the right).
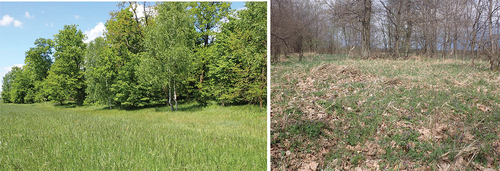
Figure 2. Examples of marked P. mnemosyne on the study site in the Narew river (NE Poland): a male (on the left) and a female with a mating plug (sphragis).
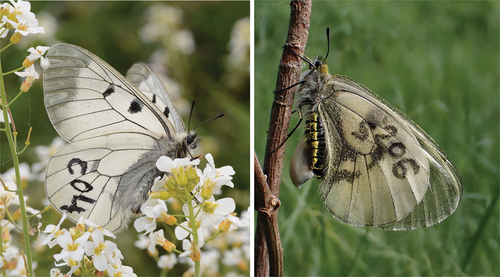
Table I. General information for the study years. Weather conditions in the flight period refer to daily means recorded between 8 a.m. and 5 p.m., i.e. the period of butterfly activity in favourable conditions. Weather conditions in April (i.e. the month most important in the context of larval development) refer to daylight time. Data were acquired from the IMGW-PIB Białystok.
Table II. Summary of mark-recapture surveys conducted.
Figure 3. Sample sizes and proportion of recaptured individuals of both sexes, in four years.
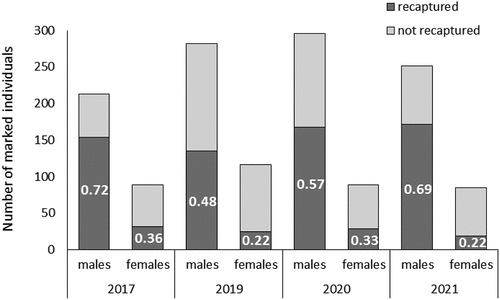
Figure 4. Mean capture probability in the four sampling years derived for males (triangles) and females (dots) as estimated with the Jolly-Seber model. Error bars represent 95% confidence intervals. Significant intersexual differences were detected for all years.
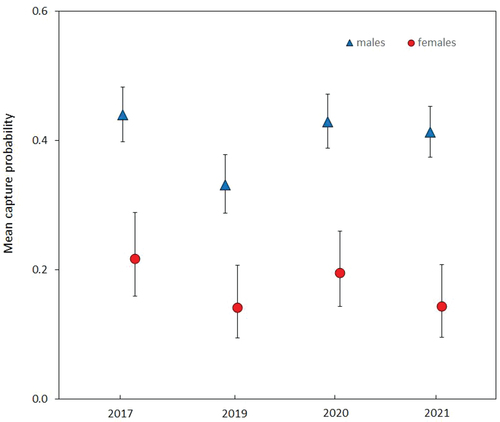
Table III. The mean numbers of days between the first and last captures in the four sampling seasons.
Table IV. Estimated population sizes for the four investigated seasons; the values in parentheses represent 95% confidence intervals.
Figure 5. Distribution of recaptured individuals according to maximum temporal distance between the first and the last capture.
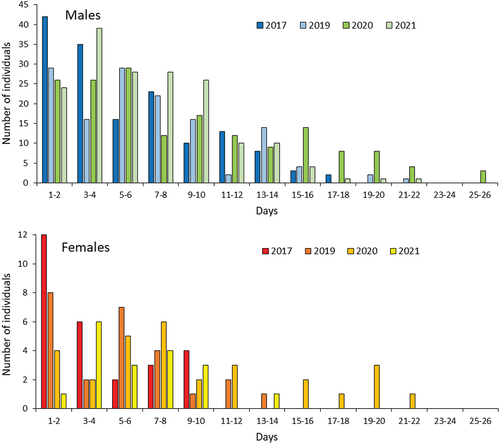
Figure 6. Wing wear of captured individuals (recaptures included) in two investigated years. Colours of bars correspond to wing wear on a 4-point scale (0 – very fresh, 1 - the least worn, 2 - moderately worn, 3 - heavily worn). Data for weeks 1–2 and 5–6 in 2019 and for weeks 4–5 in 2021 were pooled, due to very few individuals being captured in the beginning/end of the flight period.
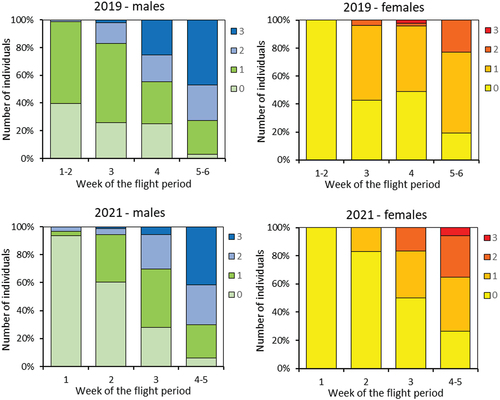
Table V. Estimates of daily survival rate and lifespan for the four investigated seasons; the values in parentheses represent 95% confidence intervals.