
Figures & data
Figure 1. Location of the colony: KOR - Koronowo, BYD - Bydgoszcz, SKO - Skoki Duże. Main habitat types according to the corine land cover CLC2012 model, level 1; https://land.copernicus.eu/pan-european/corine-land-cover/clc-2012). Natura 2000 SPAs – boundaries of Special Protection areas under the EU Birds Directive.
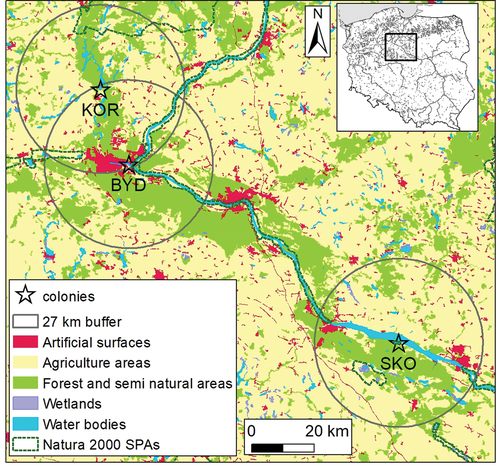
Table I. Habitat structure, i.e. relative abundance [%] of each habitat type (according to CORINE Land Cover CLC 2012 - Program monitoring land cover changes in 2006-2012 coordinated by the European Environment Agency (CORINE land cover CLC2012 model), level 1; source: https://land.copernicus.eu/pan-european/corine-land-cover/clc-2012) in buffers within a 27 km radius from each black-headed gull colony (this distance = the maximum distance of foraging flights of Global Positioning System (GPS) -tracked individuals from Bydgoszcz and Koronowo; Jakubas et al. Citation2020); chi-square statistical test of independence (χ2), level of statistical significance (p) – results of inter-colony comparison of particular habitat types (χ2 tests of independence performed on raw data from all three colonies in km2, df = 2).
Table II. Fatty acid composition [%] in subsequent eggs (A – first, B – second, C – third) of black-headed gulls breeding in the studied colonies.
Table III. Sources of variability in fatty acid compositions in eggs of black-headed gulls breeding in the studied colonies (log-transformed) (AD = average dissimilarity, CO = relative contribution), according to a SIMPER analysis with Bray–Curtis similarity measure; only elements with a contribution of >5% are presented.
Figure 2. Principal component analysis biplot of fatty acid composition in eggs of black-headed gulls breeding in the studied colonies. The analysis was based on log(x + 1)-transformed data for each fatty acid composition. Convex hulls include all samples from each colony: SKO – Skoki Duże (red), KOR – Koronowo (blue), BYD – Bydgoszcz (purple).
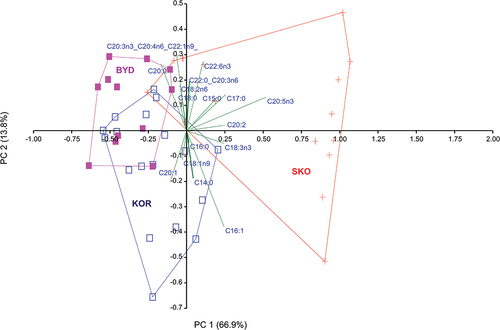
Figure 3. Composition of the fatty acids with the highest inter-colony dissimilarity in a SIMPER analyses: EPA – C20:5n3 (A), hypogeic acid – C16:1 (B), C17:0 (C), C20:0 (D). Colony abbreviations: SKO – Skoki Duże, KOR – Koronowo, BYD – Bydgoszcz. Box plots show the median (line inside the box), the first (25%) and the third (75%) quartiles (box), the lowest and the highest values within the 1.5 interquartile range (whiskers), and the outliers (dots). Values above lines indicate p values for the post hoc Wilcoxon test.
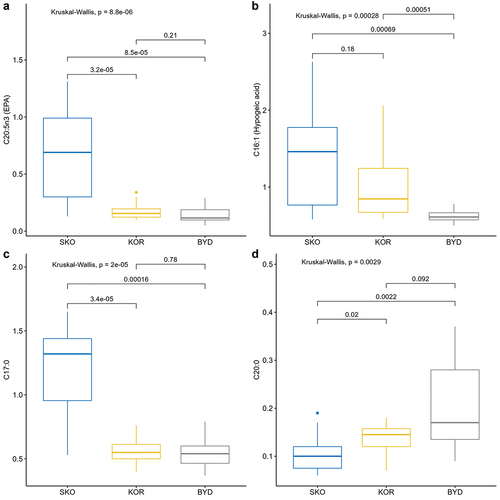
Figure 4. The ratio of: A – omega-3/omega-6, and B – omega-6/omega-3 fatty acids in eggs of black-headed gulls breeding in three colonies. Colony abbreviations: SKO – Skoki Duże, KOR – Koronowo, BYD – Bydgoszcz. Box plots show the median (line inside the box), the first (25%) and third (75%) quartiles (box), the lowest and the highest values within a 1.5 interquartile range (whiskers), and outliers (dots). Values above lines indicate p values for the post hoc Wilcoxon test.
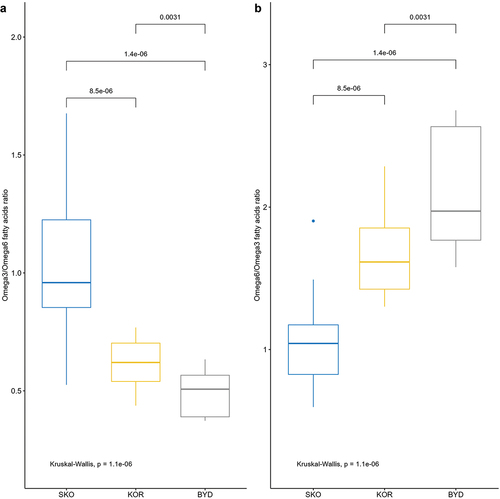
Table IV. Mean concentration (mg/g) of fatty acids and the ratio of omega-3 to omega-6 in eggs of selected species of waterbirds which include fish in their diet. Data sources: Athis study, BSpeake et al. (Citation1996), CSerré et al. (Citation2022), DSurai et al. (Citation2001). Colony abbreviations: SKO – Skoki Duże, KOR – Koronowo, BYD – Bydgoszcz.