Figures & data
Table I. Questionnaire sections and types of variables of each question.
Figure 1. Graphical representation of the redundancy analysis-constrained ordination model. Blue-headed arrows with italic-letters represent different owl symbolisms (response variables). Red-headed arrows with bold red letters represent different eras in Greek civilization (explanatory variables). Circular plots with normal small font represent different samples (cultural expressions). Arrows describing Greek periods as well as owl symbolism arrows point in the direction of the steepest increase of their values in their explanatory and response dataset, respectively. The length of the arrow is a measure of fit. The angle between arrows indicates the sign of the correlation between them: the approximated correlation is positive when the angle is sharp, negative when the angle is larger than 90 degrees and neutral when it is at 90 degrees exactly.
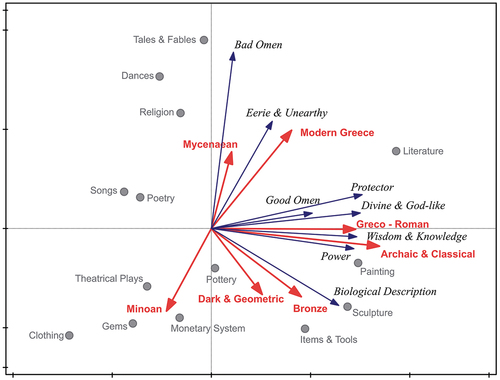
Table II. Results of redundancy analysis and permutation test on both response and explanatory matrices after 999 permutations.
Table III. Chi square tests of independence applied on interviewees’ survey responses.
Figure 2. Percentage of interviewees in rural areas and urban centers who answered whether they know if there are any owl species in the regions where they reside.
Figure 3. Percentage of interviewees from rural areas and urban centers who have directly observed an owl in nature or in other ways.
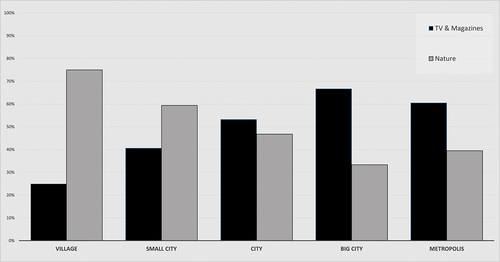
Figure 4. Answers from rural areas and urban centers in island and mainland regions in respect to whether the interviewees are familiar with at least one local or national owl legend.