Figures & data
Figure 1. Map of the study area. Red dots mark the areas in which Alitta yarae sp. nov. occurred; blue dots mark the areas where A. succinea was collected. PEC = Paranaguá Estuarine Complex.
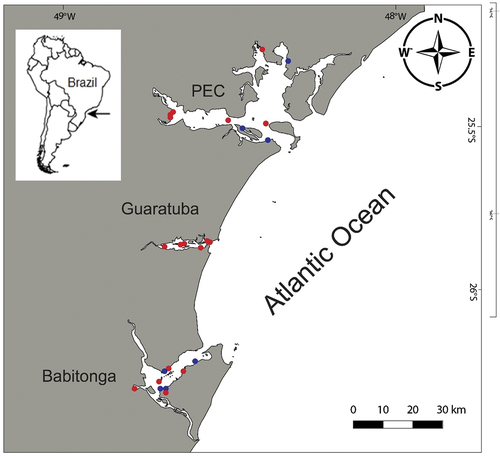
Figure 2. Anterior view of Alitta yarae sp. nov. (a) paratype (MNRJP 007662): anterior end, dorsal view. (b–d) Holotype (MNRJP 007659): (b) dorsal view, (c) ventral view, (d) lateral view. Arrows point to fleshy pads between areas VI and VII–VIII bearing paragnaths. Scale bars: A = 2 mm; B–D = 1 mm. cn, conical paragnath, pp, pyramidal paragnath.
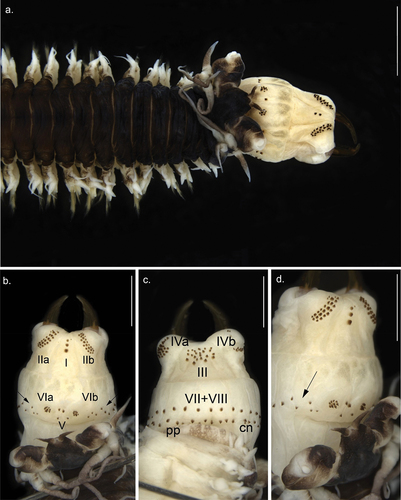
Figure 3. Parapodia and posterior end of Alitta yarae sp. nov. (a–e) Holotype (pMNRJP 007659) chaetiger; (f) paratype (MNRJP 007661), posterior end, dorsal view. Scale bars: a–e = 0.5 mm; f =1 mm. AC = anal cirrus, AL = neuroacicular ligule, DC = dorsal cirrus, DL = dorsal ligule, Gl = glandular edge, IL = inferior lobe, ML = median ligule, NeA = neurociculae; NoA = notoaciculae, Prl = notopodial prechaetal lobe, Ptl = neuropodial postchaetal lobe, VC = ventral cirrus, VL = ventral ligule.
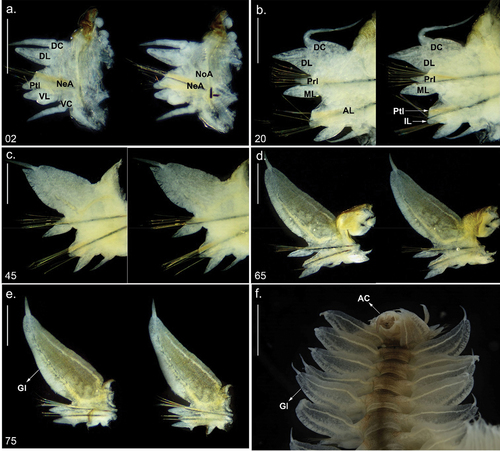
Figure 4. Detail of Alitta yarae sp. nov. chaetae from central segments (S.E.M. = scanning electron microscope; SM): (a) homogomph spiniger from notochaetae; (b) heterogomph falciger from neurochaetae; (c) heterogomph spiniger from neurochaetae. Scale bars: a = 30 µm; b, c = 50 µm.
Figure 5. Molecular-based species delineation. (a) maximum likelihood (ML) phylogeny based on cytochrome c oxidase subunit I (CO1), with information regarding the different Molecular operational taxonomic units (MOTU) delineation methods. (b) PhyloMap visualisation of Poisson tree partitions (PTP) species delimitation result. Variance explained by first and second axes: 80.35% and 16.04%, respectively. The circles represent the different haplotypes used for the analysis; the colour is relative to the result of the PTP delimitation. The complete ML phylogeny, without collapsed clades, is accessible in Suppl. file S5.
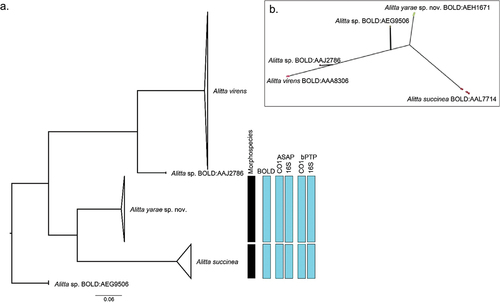
Table I. Comparison of Alitta yarae sp. nov. with the most similar congeneric species. DC = dorsal cirrus, DL = dorsal ligule.
Table II. Species, process ID, amplified loci, habitat details, and geographical coordinates for the annelid specimens used in this work.
Table III. Genetic diversity of the species found in the study area. Abbreviations: n, Number of sequences; hap, number of haplotypes; Hd, haplotype diversity; π, nucleotide diversity. The table includes Tajima’s D, Fu’s FS and their respective p values.
Figure 6. Haplotype network based on CO1 for Alitta succinea and A. yarae sp. nov. Each haplotype is represented by a circle, the size of which corresponds to the number of haplotypes as indicated in the displayed scale. Colours indicate the geographic location of the haplotype. Numbers in parentheses refer to the relative haplotype (see Suppl. Table S3).