Figures & data
Figure 1. The number of papers on farmland birds published per year, grouped by geographical regions according to all authors’ affiliations (number of records is higher than the exact number of papers due to multiple co-authors).
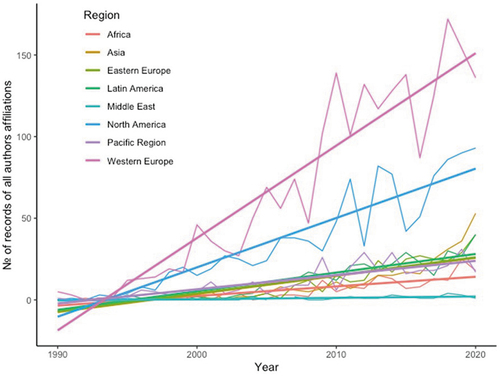
Figure 2. (a) The number of papers on farmland birds in each country during the period 1990–2020 according to the authors’ affiliation country; (b) the number of papers on farmland birds per 1 million inhabitants; (c) the number of papers on farmland birds per 10,000 km2 of agricultural area in each country; (d) the number of papers on farmland birds per bird species richness.
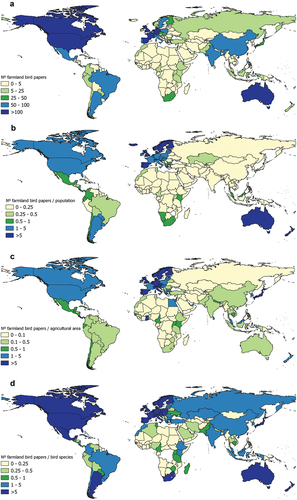
Figure 3. Network map created by VOSviewer based on co-authorships. The size of the circles is proportional to the number of papers. The different colours illustrate the different clusters in which the countries are grouped. Only countries with more than 5 papers are shown (n = 63).
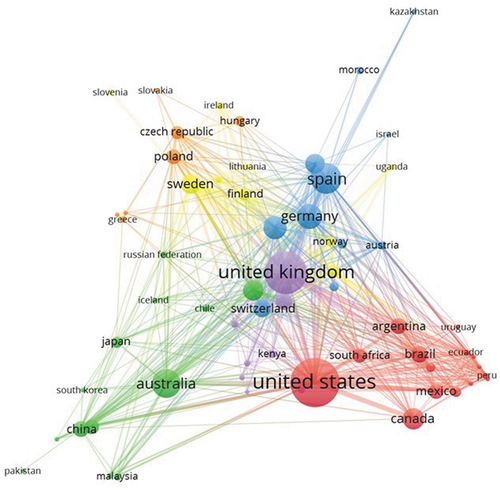
Figure 4. (a) Density-point graph showing the log-number of papers per 1 million inhabitants per country grouped by geographical regions. (b) Density-point graph showing the log-number of papers per 10,000 km2 of agricultural area per country grouped by geographical regions. Box indicates 25%–75% quantile interval and whiskers indicate first and fourth quantile range, respectively.
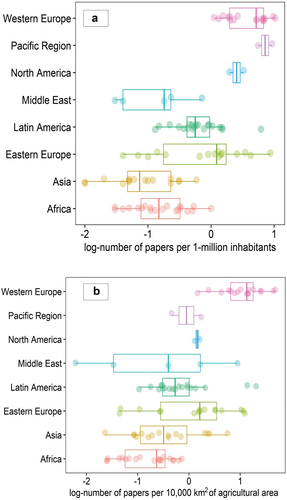
Figure 5. Network map created by VOSviewer based on co-occurrence of terms (topics) in the article title and keywords. The size of the circles is proportional to the number of papers. The different colours illustrate the different clusters in which the terms (topics) are grouped. Only terms with the top 60% relevance scores (139 terms) are plotted.
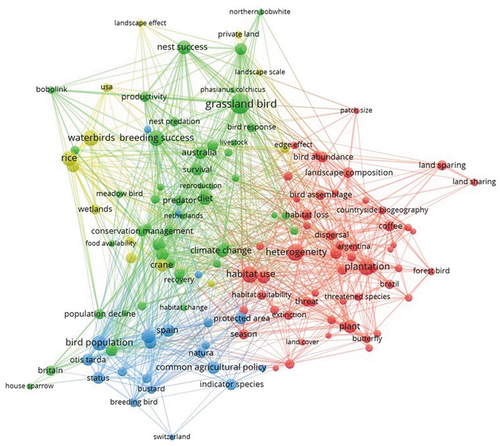
Table I. Coefficients (Coef.) and confidence intervals (CI lower limits; upper limits) of the explanatory variables including in the best candidate models (∆AIC < 2) explaining the number of papers on farmland birds.
Table II. Model selection according to the AIC criteria and model averaging results for candidate models (∆AIC < 2) explaining the number of papers on farmland birds. The coefficients for each variable in each model are shown.
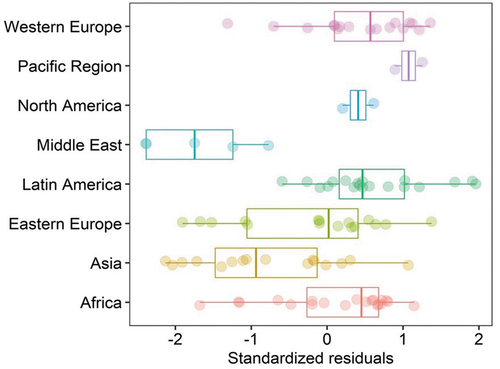
Figure 6. Standardized residuals from the model predicting the number of papers on farmland birds per 1 million inhabitants based on the variables log-papers in Scopus/1 million inhabitants, log-bird Species/km2, agriculture added value (% GPD), and the agricultural area (%) grouped by geographical regions.