
Figures & data
Figure 1. The visualization of characteristic aphid probing activities recorded on grapevine leaves using Electrical penetration graph (EPG) technique. “probe” – aphid stylets in plant tissues, “np” – no probing (= aphid stylets outside plant tissues), “C” – pathway activity in apoplast with intracellular punctures “pd”, “E1e” – watery salivation into apoplast, “E1” – watery salivation into sieve elements, “E2” – phloem sap ingestion, “F” – derailed stylet activities in apoplast, “G” – sap ingestion from xylem vessels.
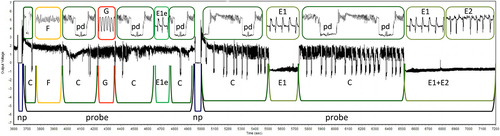
Figure 2. The visualization of measurements for anatomical evaluation of grapevine leaves. (a) abaxial epidermal cell thickness; (b) distance from abaxial leaf surface to phloem; (c) simulation of the shortest aphid stylet penetration pathway from abaxial leaf surface to phloem.
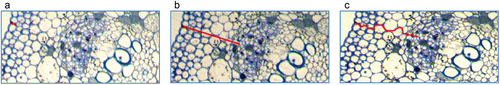
Figure 3. Temporal changes in probing behavior of Aphis fabae and Myzus persicae on white-berried grapevine cultivars “Aurora”, “Bianca”, “Muskat Letni”, and “Solaris”. np - no-probing, C – pathway, E1 – watery salivation into sieve elements, E2 – phloem sap ingestion, F – unidentified difficulties in penetration, E1e – watery salivation into apoplast, G – xylem sap ingestion, “total” – cumulative proportion of aphid activities during the 8-hour EPG monitoring.
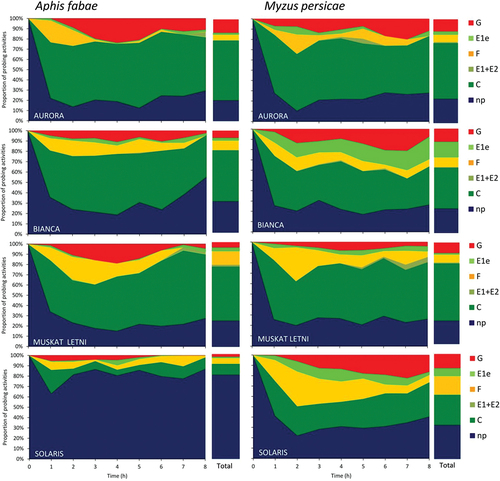
Table I. Probing behavior of Aphis fabae on white-berried grapevine (Vitis sp.) cultivars “Aurora”, “Bianca”, “Muskat Letni”, “Solaris”.
Table II. Probing behavior of Myzus persicae on white-berried grapevine (Vitis sp.) cultivars “Aurora”, “Bianca”, “Muskat Letni”, “Solaris”.
Figure 4. Proportion of Aphis fabae and Myzus persicae that reached vascular tissues – xylem and phloem – in the leaves of white-berried grapevine cultivars “Aurora”, “Bianca”, “Muskat Letni”, and “Solaris”.
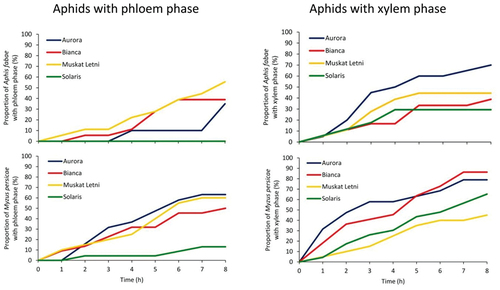
Figure 5. The variability of the quantitative traits – total durations of no probing, probing in non-phloem tissues, and probing in phloem vessels by Aphis fabae (upper graph) and Myzus persicae (lower graph) – of the white-berried grapevine cultivars in terms of the first two canonical variables. In the graph, the coordinates of the point for particular cultivar are the values for the first and second canonical variables, respectively.
Figure 6. Proportion of phenolic compounds analyzed in white-berried grapevine cultivars “Aurora”, “Bianca”, “Muskat Letni”, and “Solaris”.
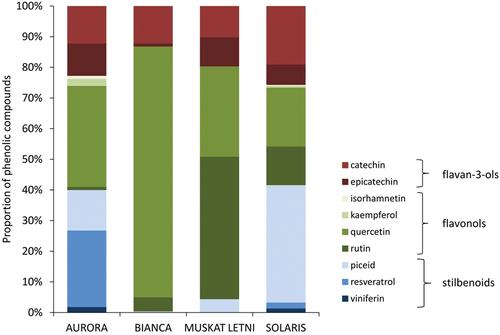
Table III. Phenolic compounds analyzed in the leaves of the white-berried grapevine cultivars “Aurora”, “Bianca”, “Muskat Letni”, “Solaris” (μg/g dry weight).
Figure 7. Representative samples of transverse leaf sections at the main veins of the leaves of the white-berried grapevine cultivars “Aurora”, “Bianca”, “Muskat Letni”, “Solaris” observed under light microscope Carl Zeiss Axio Imager 2 coupled with Zeiss AxioCam ERc 5s and ZEN lite computer programme (400x magnification). 1 – adaxial epidermis; 2 – collenchyma; 3 – parenchyma; 4 – phloem; 5 – xylem.
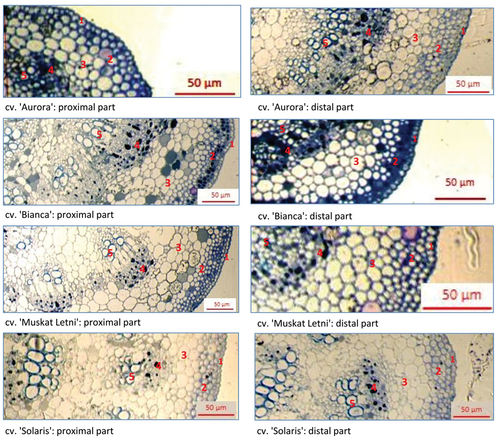
Table IV. Anatomical measurements of leaves of white-berried grapevine cultivars “Aurora”, “Bianca”, “Muskat Letni”, “Solaris”.
Data availability statement
The datasets used and/or analyzed during the current study are available from the corresponding author on reasonable request.