
Figures & data
Table I. Primer information.
Figure 1. Corresponding cell growth curve, the abscissa in the figure is the number of days of culture, and the ordinate is the total number of cells recorded by scientific notation.
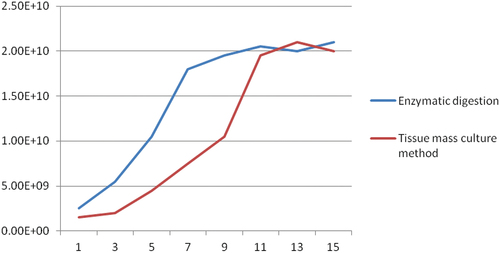
Figure 2. Histogram of cell activity. In this figure, the abscissa represents the number of days of culture and the ordinate represents the percentage of living cells.
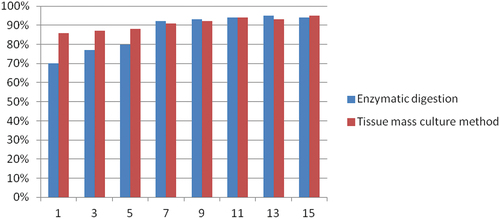
Figure 3. The photos taken during cell culture were taken before each cell bottle division. The pictures taken from a to h were taken at 1 day, 3 days, 5 days, 7 days, 9 days, 11 days, 13 days, and 15 days of cell culture, respectively.
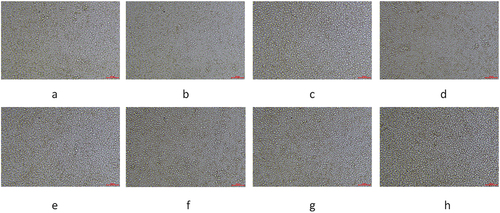
Figure 4. Evolutionary tree analysis. The tree was constructed using the molecular phylogenetic analysis by maximum likelihood method based on gene sequence in MEGA 5.1.
Figure 5. Gene sequence of TRIF cDNA in Rana dybowskii. The number of nucleotide sequences is shown from left to right. The red letters designate the start codon. The blue double underline represents the TIR domain.
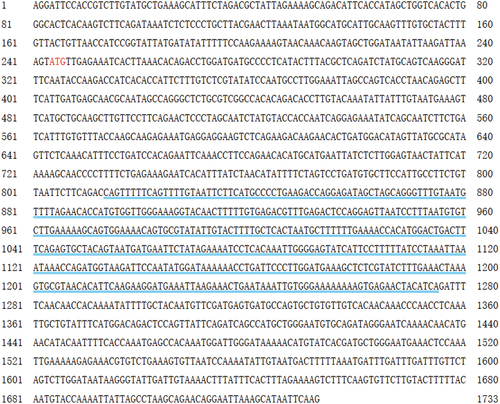
Figure 6. Protein sequence analysis and protein secondary structure prediction. The TRIF in Rana dybowskii (Rd), Danio rerio (dr), and Homo sapiens (hs). The alignment was performed by ClustalX and edited manually.
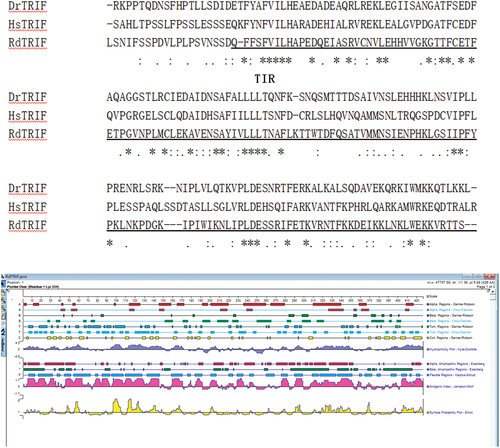
Figure 7. Phosphorylation sites.
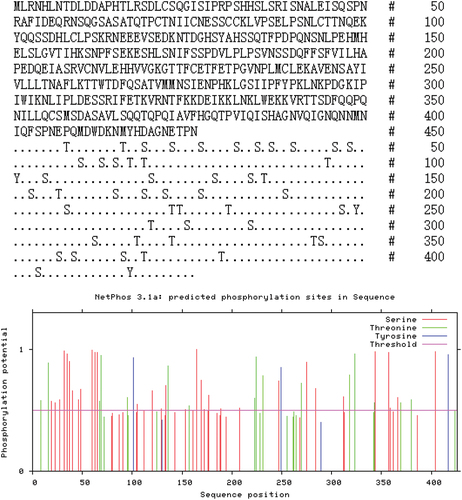
Table II. Phosphorylation sites in RdTRIF.
Figure 8. Evolutionary tree analysis. The tree was constructed with the neighbor-joining method in MEGA 5.1 based on amino acid sequences.
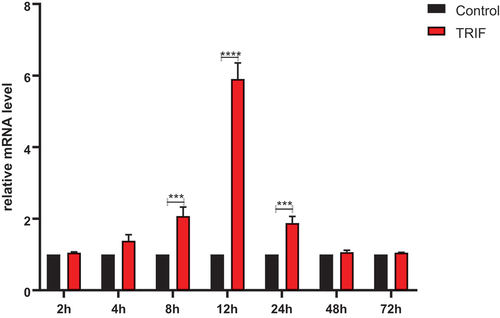
Figure 9. Expression of relative mRNA level of TRIF in the kidney. RdTRIF mRNA levels obtained from the Ah-exposed kidneys were detected by qRT-PCR. Each frog was given an intraperitoneal injection of 107 CFU/frog Ah. At 2, 4, 8, 12, 24, 48, and 72 hpi, we isolated total RNAs, with β-Actin being the endogenous reference. Data were represented in the form of mean ±SD (bars) from 3 separate assays. (***p < 0.05; ****p < 0.01).
Data availability statement
The authors confirm that the data supporting the findings of this study are available within the article.