Figures & data
Figure 1. Scheme of experimental setup. (a, b) N. davidi specimens. Bar = 0.54 cm. (c) Isolated midgut composed of the intestine and hepatopancreas. Scale bar = 0.23 cm.
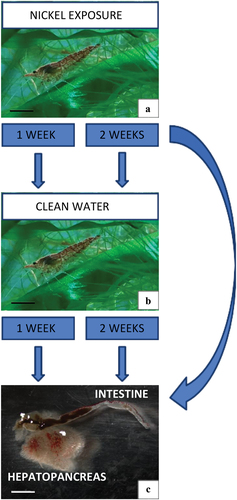
Table I. Representation of the experimental groups of adult specimens of N. davidi.
Table II. The average concentration of nickel (mean ± SD) in the body of N. davidi specimens using TXRF. Different letters (a, b, c, d) indicate statistically significant differences among experimental groups (NIR, p < 0.05, N = 6); *asterisks indicate significant differences compared to the control group (CT) (Student’s t–test, p < 0.05, N = 6).
Figure 2. Ultrastructure of the intestine epithelium of N. davidi in experimental groups: CT (a–c), Ni 1:0 (d,e), Ni 2:0 (f–h). TEM. DC - digestive cells, n - nucleus, ER - cisterns of endoplasmic reticulum, mv - microvilli, l – midgut lumen, mvb - multivesicular bodies, m - mitochondria, EC - embryonic cell, bl - basal lamina, circle - degenerating mitochondria, star - vacuolated area of cytoplasm, v - vacuole, au - autophagosome, vm - visceral muscles. Scale bar: (a) 1.4 μm, (b) 0.7 μm, (c) 1.7 μm, (d) 0.8 μm, (e) 0.7 μm, (f) 0.8 μm, (g) 1.1 μm, (h) 2 μm.
Figure 3. Ultrastructure of the intestine epithelium of N. davidi in experimental groups: Ni 1:1 (a,b), Ni 1:2 (c–e), Ni 2:1 (f–h), Ni 2:2 (i,j). TEM. n - nucleus, ER - cisterns of endoplasmic reticulum, mv - microvilli, l – midgut lumen, m - mitochondria, bl - basal lamina, circle - degenerating mitochondria, star - vacuolated area of cytoplasm, au - autophagosome, vm - visceral muscles. Scale bar: (a) 0.57 μm, (b) 0.83 μm, (c) 1.1 μm, (d) 1.1 μm, (e) 1 μm, (f) 1 μm, (g) 1.6 μm, (h) 0.6 μm, (i) 1.4 μm, (j) 1.2 μm.
Figure 4. Ultrastructure of the hepatopancreas of N. davidi in experimental groups: CT (a–c), Ni 1:0 (d,e), Ni 2:0 (f–h). TEM. EC - embryonic cell, FC - F-cell, RC - R- cell, BC - B-cell, n - nucleus, ER - cisterns of endoplasmic reticulum, mv - microvilli, l – midgut lumen, m - mitochondria, rm - reserve material, au - autophagosome, v – vacuole. Scale bar: (a) 1 μm, (b) 1 μm, (c) 0.86 μm, (d) 2.4 μm, (e) 1.4 μm, (f) 1 μm, (g) 0.8 μm, (h) 0.8 μm.
Figure 5. Ultrastructure of the hepatopancreas of N. davidi in experimental groups: Ni 1:1 (a–c), Ni 1:2 (d,e), Ni 2:1 (f–h), Ni 2:2 (i–k). TEM. FC - F-cell, RC - R- cell, BC - B-cell, n - nucleus, ER - cisterns of endoplasmic reticulum, mv - microvilli, l – midgut lumen, m - mitochondria, rm - reserve material, au - autophagosome, v – vacuole. Scale bar: (a) 1.9 μm, (b) 1.3 μm, (c) 1.7 μm, (d) 0.8 μm, (e) 0.5 μm, (f) 0.7 μm, (g) 1 μm, (h) 1 μm, (i) 1 μm, (j) 1.7 μm, (k) 1 μm.
Figure 6. Histochemical staining of the midgut of N. davidi. Light microscope. Scale bars: (A6) 7 μm, (F2) 12 μm, (A4, E1, F3, F7) 13 μm, (C2, C7, D5) 14 μm, (B1, F6) 14.5 μm, (A5, C4, E3, F4) 15 μm, (C3, D6, E2, E6) 16 μm, (A2, C1, D2, E4, E7) 17 μm, (A1, C6, D7, F1) 18 μm, (B2, B4, B6, D1) 19 μm, (D4) 21 μm, (A3, B3, B5, C5, F5) 22 μm, (A7) 23 μm, (B7) 26 μm.
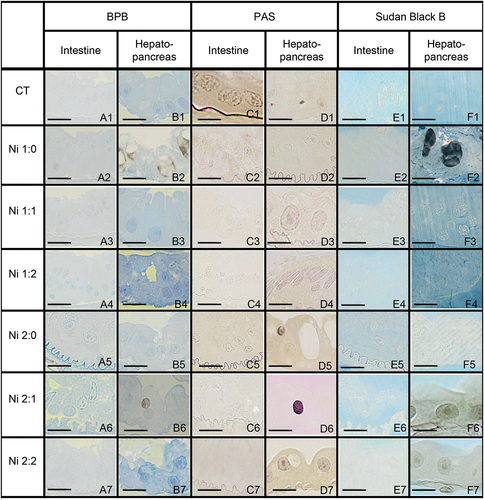
Figure 7. Localization of acid structures (red signals) in the intestine and hepatopancreas of N. davidi. Blue signals - nuclei. Confocal microscopy. Scale bar = 45 μm.
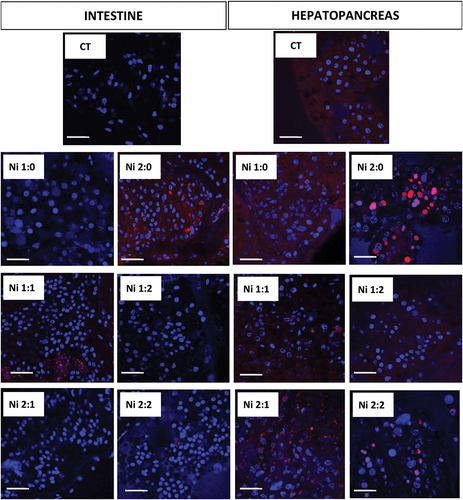
Figure 8. Quantitative cell death analysis in the midgut of N. davidi. (a,b) Percentage of early apoptotic cells (mean ± SE) in the intestines (a) and hepatopancreases (b) Subjected to nickel exposure for 1 week (Ni: 1 week) or 2 weeks (Ni: 2 weeks). (c,d) Percentage of late apoptotic cells (mean ± SE) in the intestines (c) and hepatopancreases (d) of N. davidi individuals subjected to nickel exposure for 1 week (ni: 1 week) or 2 weeks (Ni: 2 weeks). (e,f) Percentage of necrotic cells (mean ± SE) in the intestines (e) and hepatopancreases (f) of N. davidi individuals subjected to nickel exposure for 1 week (Ni: 1 week) or 2 weeks (Ni: 2 weeks). Different letters (a, b) indicate statistically significant differences between experimental groups: CT (control), Ni (nickel exposure), Ni:1 (nickel exposure and 1-week purification), Ni:2 (nickel exposure and 2-week purification), within each exposure time (1 or 2 weeks) using the NIR test, p < 0.05. Asterisks (*) indicate statistically significant differences between complementary experimental groups at both metal exposure times (Student’s t-test, p < 0.05).
Figure 9. Quantitative analysis of caspase activity in the midgut of N. davidi. (a–d) The percentage of viable cells (a) Viable caspase-positive cells (b) Dead caspase-positive cells (c) and dead cells (d) in the intestine of N. davidi individuals exposed to nickel for 1 week (Ni: 1 week) or 2 weeks (Ni: 2 weeks). (e–h) The percentage of viable cells (e) Viable caspase-positive cells (f) Dead caspase-positive cells (g), and dead cells (h) in the hepatopancreas of N. davidi individuals exposed to nickel for 1 week (Ni: 1 week) or 2 weeks (Ni: 2 weeks). Different letters (a, b, c) indicate statistically significant differences between the experimental groups (CT - control; Ni - nickel exposure; Ni: 1 - nickel exposure and 1-week purification; Ni: 2 - nickel exposure and 2-week purification) within each exposure time (1 or 2 weeks), using the NIR test, p < 0.05. Asterisks (*) indicate statistically significant differences between complementary experimental groups at both metal exposure times (Student’s t-test, p < 0.05).
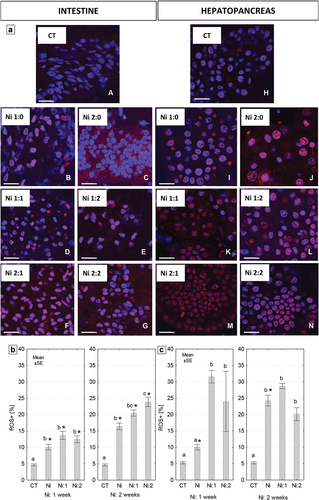
Figure 10. (a) Localization of reactive oxygen species (ROS) (red signals) in the intestine and hepatopancreas of N. davidi. Blue signals - nuclei. Confocal microscopy. Scale bar = 22.5 μm. (b,c) The percentage (mean ± SE) of reactive oxygen species-positive (ROS+) cells in the intestine (b) and hepatopancreas (c) of N. davidi individuals subjected to nickel exposure for 1 week (Ni: 1 week) or 2 weeks (Ni: 2 weeks). Different letters (a, b, c) indicate statistically significant differences between experimental groups: CT (control), Ni (nickel exposure), Ni:1 (nickel exposure and 1-week purification), Ni:2 (nickel exposure and 2-weeks purification) within each exposure time (1 or 2 weeks) NIR test, p < 0.05. Asterisks (*) indicate statistically significant differences between complementary experimental groups at both metal exposure times (Student’s t-test, p < 0.05).