
Figures & data
Figure 1. a, Phylogeny of the studied Lasius species, manually re-drawn based on Seifert (Citation2020), Maruyama et al. (Citation2008), Blatrix et al. (Citation2020) and Boudinot et al. (Citation2022). b, Pictures of the head of individuals (Q = queen, M = male, W = worker) from two of the studies species (one parasitic and one non-parasitic).
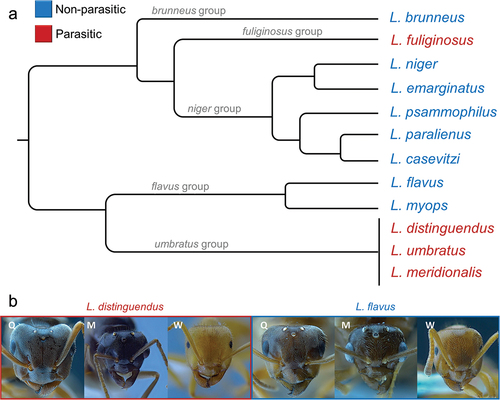
Table I. Mean values ± SE of the ranked % of Zn and Mn, per species and caste.
Figure 2. Examples of SEM images of male, queen and worker mandibles of L. distinguendus (parasite) (a–c) and L. psammophilus (not parasite) (d–f). g–l, the EDS spectra for the mandibles of the individuals shown in a–f. Zn and Mn peaks are indicated and drawn from zoomed images in grey circles.
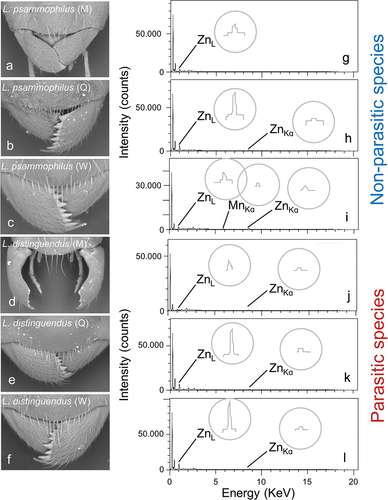
Figure 3. Box-and-whisker plots showing medians (horizontal lines within boxes), 1° and 3° quartile (horizontal lines closing the boxes), and maximum and minimum values (ends of the whiskers) for the ranked values of Zn (a, c) and Mn (b, d), calculated across species, in males (M), queens (Q) and workers (W) (a-b) and in workers of parasitic and non-parasitic species (c-d). * = [0.1 ≥ p ≥0.01], ** = P < 0.01.
![Figure 3. Box-and-whisker plots showing medians (horizontal lines within boxes), 1° and 3° quartile (horizontal lines closing the boxes), and maximum and minimum values (ends of the whiskers) for the ranked values of Zn (a, c) and Mn (b, d), calculated across species, in males (M), queens (Q) and workers (W) (a-b) and in workers of parasitic and non-parasitic species (c-d). * = [0.1 ≥ p ≥0.01], ** = P < 0.01.](/cms/asset/1af1bad9-4c88-445d-89a3-c9a8f1b800de/tizo_a_2355308_f0003_oc.jpg)
Table II. Results of the General Linear Model (GLM) analysis for Zn, Mn, and Cl. Explanatory variables were caste (W = worker, Q = queen) and biology (p = parasitic). SE = Standard Error. In bold, P-values <0.05.