Figures & data
Table I. Duration (in days, average ± SD [range]), length and width (in µm, average ± SD [range]) of larvae (L), protonymphs (P), deutonymphs (D) and females (F) and the length:width ratio ([range]:1) in the first day (after moult) and the last day (before moult to the next stage, juveniles) in Z. hamaricus; statistical significance of length/width change before/after moult between L and P, P and D and D and female.
Table II. Share (in % per sample) of larvae (L), protonymphs (P), deutonymphs (D), females (F) and males (M), total abundance (A) of sample and stage, female:male (F:M) and juvenile:adult (juv:ad) ratios of Z. hamaricus in samples collected at its type locality.
Figure 1. Zercon hamaricus SEM (Scanning Electron Microscopy) micrographs of eggs. (a) air-dried egg; (b) egg dried with the use of HMDS (hexamethyldisilazane); (c,d) exochorion; (e) typical view of hatched egg; (f) inner surface of egg chorion; (g,h) stoma-like structure on the inner egg surface (asterisk). Scale bars (µm): a–c, e = 50; d, f–h = 25.
Figure 2. Zercon hamaricus micrographs. (a) egg, stereomicroscopic view; (b) opened egg on a moss twig, stereomicroscopic view; (c) larva, posterior view of anal region, SEM (Scanning Electron Microscopy) micrograph. Scale bars (µm): a, b = 100; c = 25.
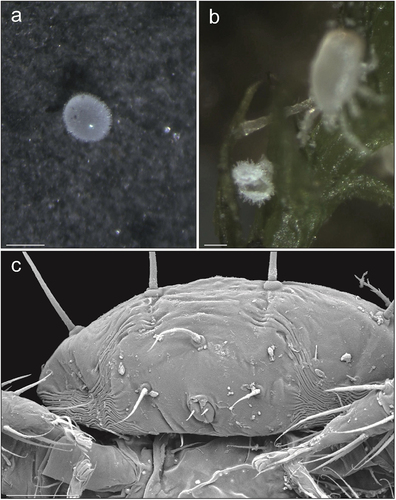
Figure 3. SEM (Scanning Electron Microscopy) micrographs of a Zercon hamaricus larva. (a) dorsal habitus; (b) lateral habitus; (c) anterior part of idiosoma, lateral view; (d) posterior part of idiosoma, lateral view; (e) sternal and anal region; (f) epistome; (g) opisthonotum, dorsal view; (h) opisthonotum, posterodorsal cavities. Scale bars (µm): a, b, g = 100; c, d, e = 50; f, h = 25.
Figure 4. SEM (Scanning Electron Microscopy) micrographs of a Zercon hamaricus protonymph. (a) dorsal habitus; (b) lateral habitus; (c) anterior part of idiosoma, lateral view (*metapodal plate); (d) posterior part of idiosoma, lateral view; (e) sternal and anal region; (f) epistome; (g) opisthonotum, dorsal view; (h) peritreme, lateral view. Scale bars (µm): a, b = 150; c–e = 50; f, h = 25; g = 100.
Figure 5. SEM (Scanning Electron Microscopy) micrographs of a Zercon hamaricus deutonymph. (a) dorsal habitus; (b) lateral habitus; (c) anterior part of idiosoma, lateral view; (d) posterior part of idiosoma, lateral view (*metapodal plate); (e) sternal region; (f) epistome; (g) opisthonotum, dorsal view; (h) peritrematal region, lateral view. Scale bars (µm): a, b = 200; c, e, h = 50; d = 100; f = 25; g = 150.
Figure 6. SEM (Scanning Electron Microscopy) micrographs of a female Zercon hamaricus. (a) dorsal habitus; (b) lateral habitus; (c) anterior part of idiosoma, lateral view; (d) posterior part of idiosoma, lateral view; (e) sternal region; (f) epistome; (g) opisthonotum, dorsal view; (h) peritrematal region, lateral view (*post-coxal cuticular spines). Scale bars (µm): a, b, g = 200; c–e = 100; f = 25; h = 50.
Figure 7. SEM (Scanning Electron Microscopy) micrographs of a male Zercon hamaricus. (a) dorsal habitus; (b) lateral habitus; (c) anterior part of idiosoma, lateral view; (d) posterior part of idiosoma, lateral view; (e) sternal region; (f) epistome; (g) opisthonotum, dorsal view; (h) peritrematal region, lateral view (*post-coxal cuticular spines). Scale bars (µm): a, b, g = 200; c–e = 100; f = 25; h = 50.
Figure 8. SEM (Scanning Electron Microscopy) micrographs of Zercon hamaricus. (a) female, anterior view; (b) female, posterior view; (c) chelicera of male; (d) chelicera of female; (e) post-coxal region of male, ventral view; (f) post-coxal region of deutonymph, ventral view (*metapodal plate); (g) post-coxal region of a deutonymph, lateral view (*metapodal plate); (h) post-coxal region of protonymph, ventral view (*metapodal plate). Scale bars (µm): a, b = 100; c–f, h = 25; g = 50.
Figure 9. Micrographs of a female Zercon hamaricus. (a) peritrematal shield, SEM (Scanning Electron Microscopy) micrograph, ventral view; (b, d) peritrematal shield and post-coxal region, transmitted light microscopy, ventral view; (c, e) magnifications of the areas marked with rectangles on “b” and “d”, respectively. *post-coxal cuticular spines. Scale bars (µm): a, c, e = 50; b, d = 100.