
Figures & data
Table I. Factors for analysing effects on Common Buzzard flight initiation distance.
Figure 1. Data distribution of flight initiation distance (m) of Common Buzzards Buteo buteo.
Figure 2. Mean number (dots), 95% confidence limits (vertical lines) and kernel distribution (violins) of recorded flight initiation distances in two types of habitats.
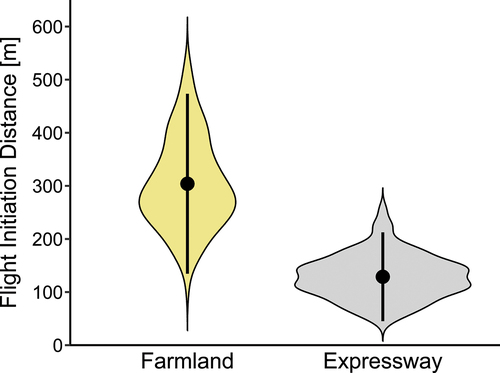
Table II. Results of models describing the influence of different factors on Common Buzzard flight initiation distance. Degrees of freedom (df), model log-likelihood (LL), corrected AIC criterion (AIC), difference between the model and the best model in the data set (Δ AIC), and weight for the model (AICwt) are shown.
Table III. Estimates of GLM model coefficients for the best model of factors affecting FID.
Data availability statement
Dataset supporting reported results can be found at the Mendeley Data Repository: https://doi.org/10.17632/k7jwk6pgpc.1