Figures & data
Figure 1. Map displaying the research area with four sampling sites in the southern coastal region of Bangladesh: Kalapara (S1, 21°98′61″N, 90°24′22″E), Alipur (S2, 22°25′55.0″N, 90°51’16.2″E), Amtoli (S3, 22°12′71.9″N, 90°22′82.5″E), and Tengragiri (S4, 21°96′34.79″N, 89°96′42.68″E).
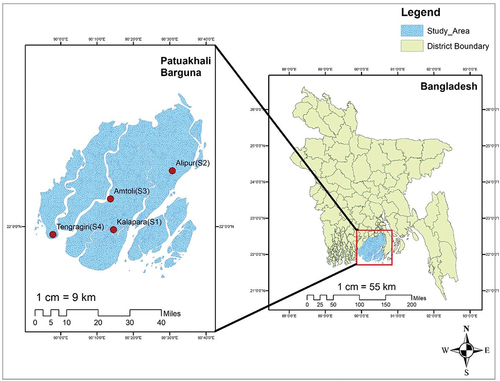
Figure 2. Flow diagram of the data collection method for ichthyofaunal diversity in the south-central coastal region.
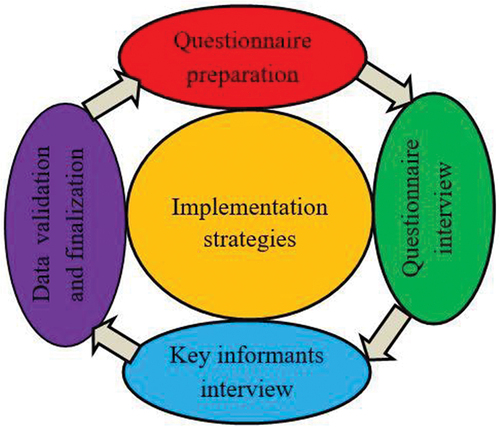
Figure 3. Percentage composition of families, genera and species of ichthyofaunal diversity documented in the south-central coastal regions of Bangladesh.
Table I. Ichthyofaunal abundance and conservation status of recorded individuals at four stations in the south-central coastal regions of Bangladesh.
Figure 4. Temporal abundance of the 10 most abundant fish species in the study area.
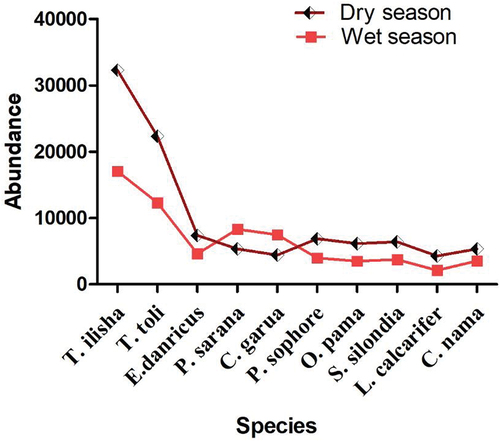
Table II. Total number of fish species and individuals identified from four stations in the south-central coastal waters of Bangladesh.
Figure 5. Conservation status of fish species recorded in our study under International Union for Conservation of Nature (IUCN) and Bangladesh (BD) red list categories.
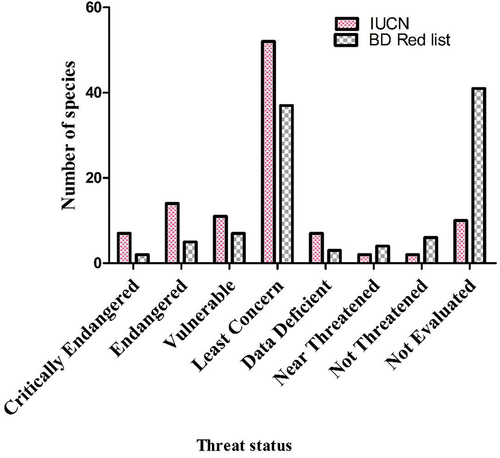
Figure 6. Number of species in various threat categories recorded in the present study.
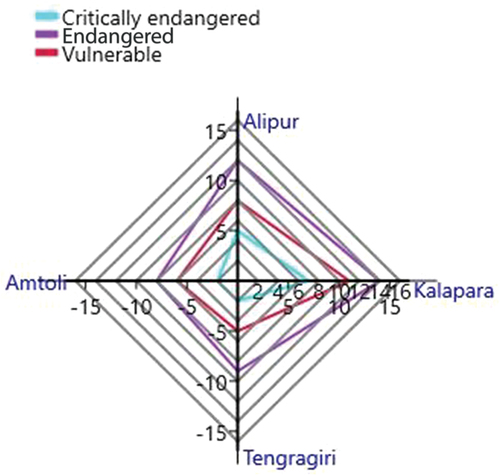
Figure 7. Various diversity indices measured at sampling locations in the southern coastal region.
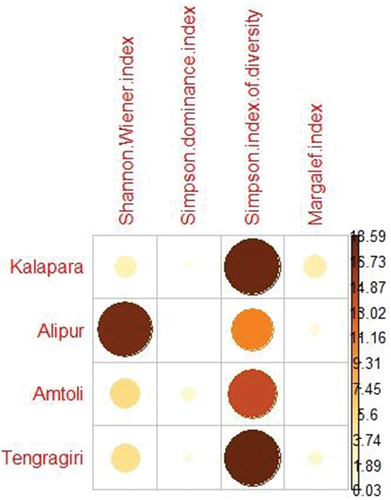
Figure 8. Evenness of ichthyofaunal diversity in four sampling stations.
Figure 9. The temporal fish assemblage cluster constructed as per the Bray-Curtis similarity matrix.
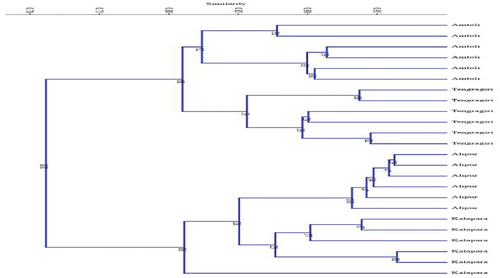
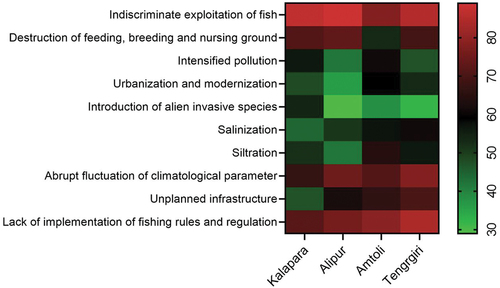
Figure 10. A heat map depicting the reasons for ichthyofaunal diversity in the south-central coastal region.