Figures & data
Table 1. Characteristics of the study subjects.
Figure 1. PEth serum levels of the alcohol-dependent patients during alcohol withdrawal compared to the healthy controls (nondrinkers and social drinkers). The difference between the groups (patients [day 1], nondrinkers, and social drinkers) with respect to the PEth levels showed marginal trends towards significance (p = 0.052). PEth levels of the patients decreased statistically significantly during alcohol withdrawal (p = 0.002).
![Figure 1. PEth serum levels of the alcohol-dependent patients during alcohol withdrawal compared to the healthy controls (nondrinkers and social drinkers). The difference between the groups (patients [day 1], nondrinkers, and social drinkers) with respect to the PEth levels showed marginal trends towards significance (p = 0.052). PEth levels of the patients decreased statistically significantly during alcohol withdrawal (p = 0.002).](/cms/asset/2ae9c171-3312-4f5e-9d9a-c0bf643ddc60/tbcp_a_1293249_f0001_c.jpg)
Table 2. Biomarker levels of the study subjects and clinical features of alcohol withdrawal.
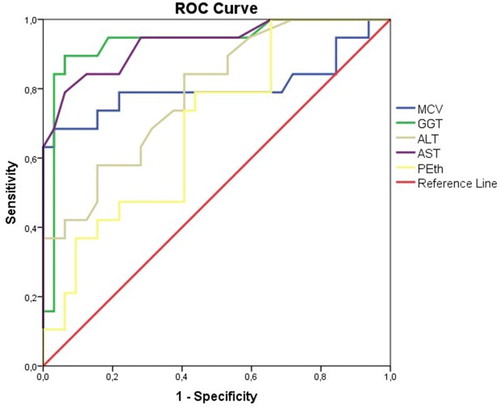
Figure 2. ROC curve analysis for the alcohol-dependent patients versus healthy controls, with PEth, GGT, MCV, ALT, and AST as test variables. PEth was found to have statistically significant diagnostic efficacy for detecting chronic heavy drinking according to the ROC curve analysis (p = 0.024), but traditional biomarkers performed better than PEth.