Figures & data
Figure 1. Total locomotor activity in the activity cage separately for the Control, DMSO, Diabetes, and Diabetes + YC-1 and Diabetes + Zaprinast (n = 9 in each group). Each value represents the mean ± S.E.M. There were no significant differences between the groups.
Figure 2. Footshock sensitivity scores separately for Control, DMSO, Diabetes, Diabetes + YC-1 and Diabetes + Zaprinast groups (n = 9 in each group). Each value represents the mean ± S.E.M. There were no significant differences between the groups.
Figure 3. (a) Acquisition and (b) Retention latencies in passive avoidance test separately Control, DMSO, Diabetes, Diabetes + YC-1 and Diabetes + Zaprinast groups (n = 9 in each group). Each value represents the mean ± S.E.M. There were no significant differences between the groups in the acquisition test. On the other hand, diabetic rats exhibited a significantly lower latency compared to control rats (***p < .001), and Diabetes+ YC-1 and Diabetes + Zaprinast groups showed higher latency compared to diabetic rats (###p < .001) in the retention test (one-way ANOVA, Bonferroni corrected). There were nine animals in each group.
Figure 4. Morris Water Maze (a) Acquisition (b) Probe test performance separately the Control, DMSO, Diabetes, Diabetes + YC-1 and Diabetes + Zaprinast groups (n = 9 in each group). Diabetes resulted in a significant disruption in learning as indicated by an increase in the escape latency compared with the control animals in the acquisition test (two-way ANOVA, Bonferroni test, effect of treatment, ***p < .001). In addition, both YC-1 (##p < .01, ##p < .01, ###p < .001, ##p < .01, respectively) and zaprinast (+++p < .001, ++p < .01, ++p < .01, +++p < .001, respectively) treatments had a significant effect on acquisition latency in the MWM test in the first 1–4 days compared to diabetic rats. There was a significant difference between diabetes and control groups in the time spent in the correct quadrant during the probe trial of the MWM test (one-way ANOVA, Bonferroni test, F(4,40)=7.330, p < .001). Both YC-1 and zaprinast prolonged the time spent in the correct quadrant.
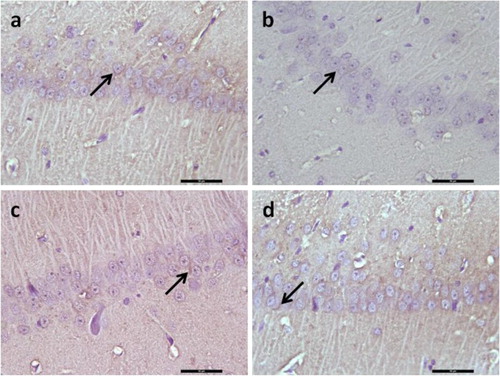
Figure 5. Representative image illustrating BDNF expression (arrows) in hippocampal formation. Control (a), Diabetes (b), Diabetes + YC-1 (c) and Diabetes + Zaprinast group in CA1 region. BDNF expression was decreased in diabetes in CA1 region of the hippocampus, whereas in diabetes + YC-1 and diabetes + zaprinast rats BDNF was similar to those in the control group in the CA1 regions. Scale bars: 50 μm.