Figures & data
Figure 1. The measurment of orbitofrontal cortex (a), anterior cingulate cortex (b), and dorsolateral prefrontal cortex (c,d) in sagittal T2 images.
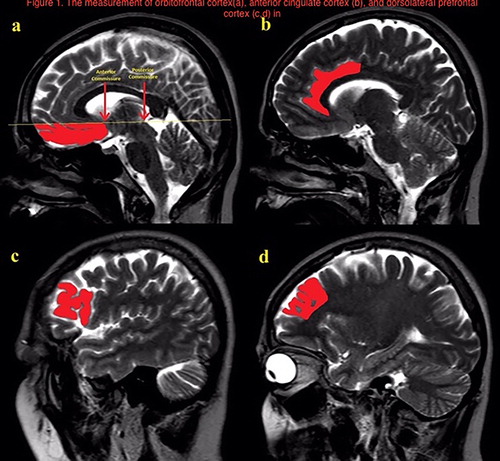
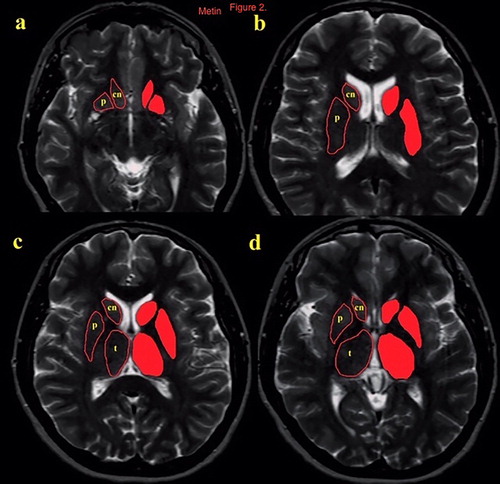
Figure 2. The measurment of striatum and thalamus (a–d) in sequential axial T2 images.