Figures & data
Table 1. Sociodemographic and Clinical Variables in AT OCD and RT OCD.
Table 2. Sociodemographic and Clinical Variables in OCD and Control Groups.
Table 3. Comparison of IL-1ß, IL-6, TNF-α Serum Levels and Neurocognitive Test Scores of patients with OCD and Control Group.
Table 4. Correlation of Neurocognitive Test Scores and IL-1ß, IL-6, TNF-α Serum Levels in Patients with OCD.
Table 1. Scores of age and ways of coping questionnaire.
Table 2. Stress coping ways according to fibromyalgia severity.
Table 1. Personality disorders in women with migraine and without migraine.
Table 1. Comparison of Tryptophan, Kynurenine, Kynurenic Acid, Quinolinic Acid, KIN / TRP Ratio and KYNA/QA ratio of patient and control groups.
Table 1. Clinical and sociodemographic charactrsitics of patients with bipolar disorder type I (n=172).
Table 2. Frequency of personality disorders by cluster in patiemts with bipolar disorder type I (n=172).
Table 3. Multivarite analysis of factors associated with suicide attemps in the total sample (n=172).
Table 1. Comparison of MACROD2 Gene Expression Level Between the Two Groups.
Figure 1. Boxplot Graphic View of MACROD2 Gene Expression Level of Patient and Control Groups (independent samples t test).
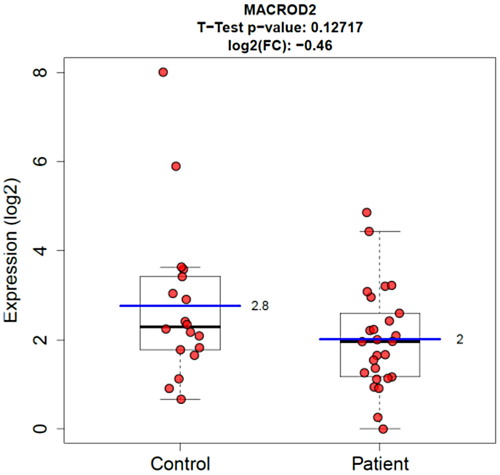
Figure 2. Boxplot Graphic View of MACROD2 Gene Expression Level of Patient and Control Groups (Wilcoxon Rank Sum test).
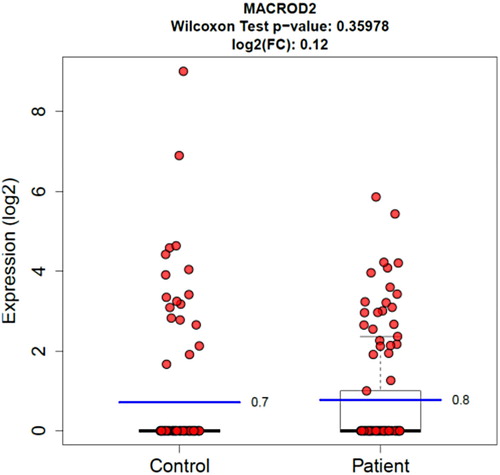
Table 1. Comparison of Metacognition Questionnaire-30, Thought Control Scale, Social Functional Scale, Beck Depression Inventory, Beck Anxiety Inventory, and subgroup scores between the groups.
Table 1. Descriptive statistics as well as results of the anova and post-hoc analyze for global and specific difficulties in regulating emotions between the bipolar, depressive, and healthy control groups.
Table 2. Descriptive statistics as well as results of the anovas and post-hoc tests for global and specific difficulties in regulating emotions.
Table 3. Descriptive statistics as well as results of the anovas for global and specific difficulties in regulating emotions for the participants diagnosed with a psychiatric disorder and taking 1 as well as 2 or medications.
Figure 1. Graphical representation of the comparison of daily use of social media networks with SAS-SV scores.
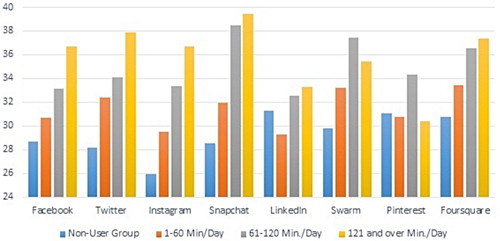
Figure 2. Graphical representation of the comparison of daily use of social media networks with PAQI scores.
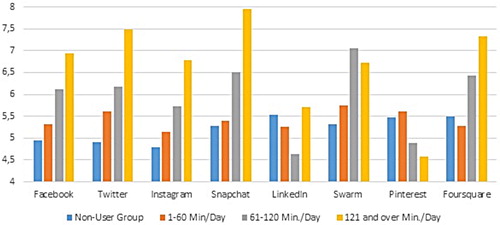
Table 1. Comparisons of SAS-SV scores with daily usage of social media networks.
Table 2. Comparisons of PSQI Scores with daily usage of social media networks.
Figure 1. The mean number of myths in study groups.
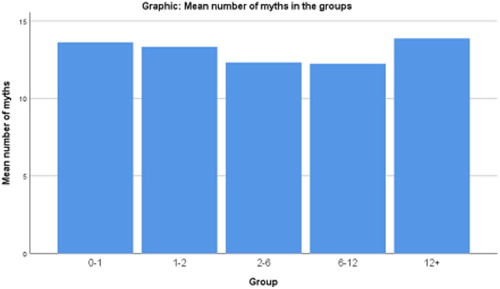
Table 1. Comparison of Holter Results.
Table 2. Correlations Between Holter Results And psychometric scales.
Table 3. Holter Results Predicting Panic Disorders In Logistic Regression.
Table 1. Mean scores of the scales between groups.
Table 2. Correlations of the scales in the patient group.
Table 1. Comparison of PLT and MPV values of patient and control groups.
Figure 1. ROC curve for RDW.
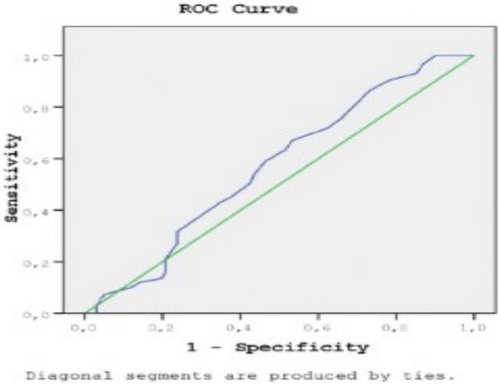
Table 1. Sociodemographic and clinical characteristics of the patients.
Table 2. SANS, SAPS scores of the groups before and after the antipsychotic treatment.
Table 1. Sociodemographic characteristics of the participants.
Table 2. Means and standart deviations of the Pittsburgh Sleep Quality Index (PSQI) total and sub-scores of ADHD and the control group.
Table 3. Means and standart deviations of the Child Sleep Habits Questionnaire (CSHQ) Abbreviated Form total and sub-scores of ADHD and the control group.
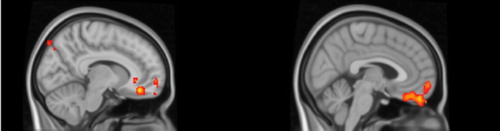
Figure 1. Anterior Cingulate Cortex (right) and medial frontal cortex (right) are the identified areas showing greater activation in children with ADHD compared to the controls.