Figures & data
Figure 1. Distributions of cross-validation results for train data from six candidate regression models.
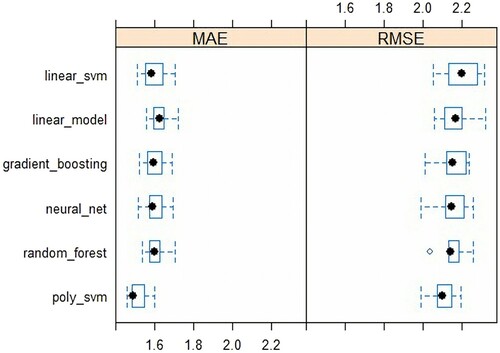
Figure 2. MAE and RMSE results for valid datasets from candidate regression models.
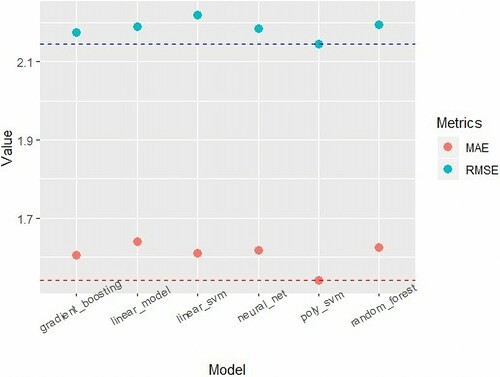
Figure 3. Top 10 Relative features for final regression model by traditional machine learning.
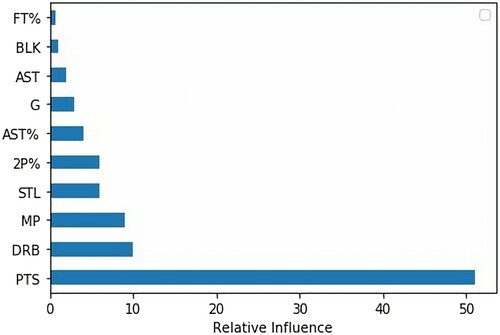
Table 1. Cross-validation results on random-, SMOTE over-sampling and under-sampling without predictor variable ‘being selected for this season all-star game’ for train data.
Table 2. Cross-validation results on random-, SMOTE over-sampling and under-sampling with predictor variable ‘being selected for this season all-star game’ for train data.
Table 3. Results on valid data from candidate classification models without predictor variable ‘being selected for this season all-star game’.
Table 4. Results on valid data from candidate classification models with predictor variable ‘being selected for this season all-star game’.
Figure 4. Top 10 Relative features for final classification model by traditional machine learning.
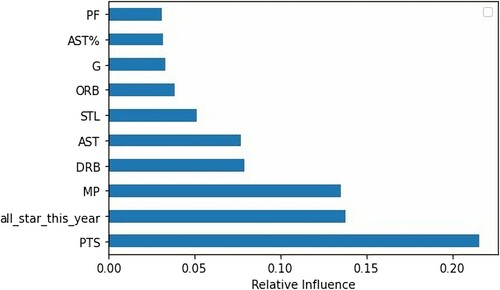
Figure 5. Loss function results for train and valid data and evaluation loss for test data from each candidate deep learning model.
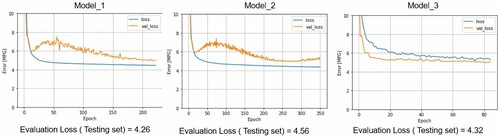
Figure 6. ROC curve for train data from each candidate deep learning model.
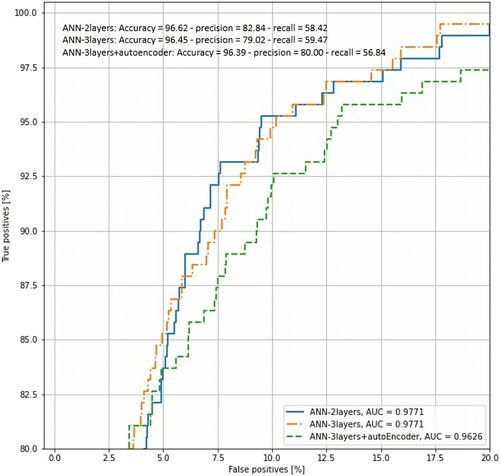
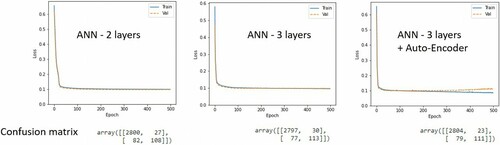
Figure 7. Loss function results for train and valid data and confusion matrix results for test data from each candidate deep learning model.