
Figures & data
Table 1. Number of data in Dataset-1 and Dataset-2 (train and test split).
Table 2. Sample records from the Dataset.
Table 3. Vector representation of the sentences.
Figure 1. Class labels of the combined dataset.
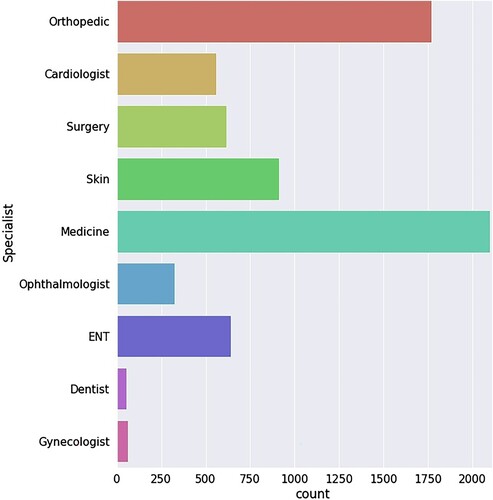
Figure 2. Basic abstract of the methodology.
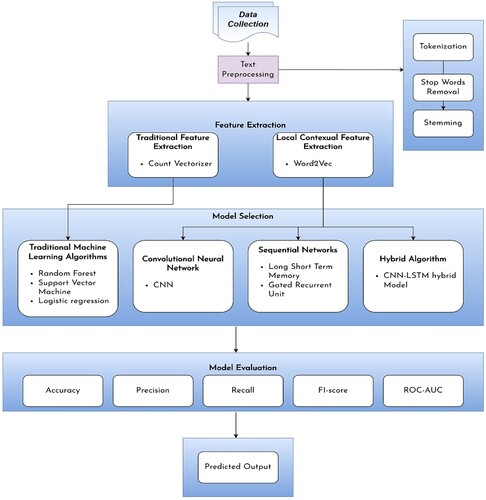
Figure 3. Convolutional neural network architecture.
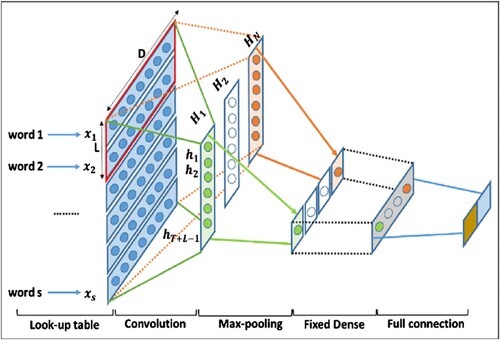
Table 4. Test performance result (Dataset 1).
Table 5. Test performance result (Dataset 2).
Table 6. Deep-learning model performance after 30 epochs (Dataset 1).
Figure 4. Training and testing loss values (first column) and accuracy values (second coloumn) using different deep-learning models using Dataset 1 during 30 epochs.
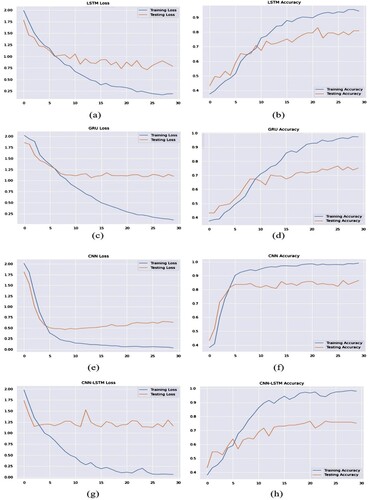
Figure 5. Training and testing loss values (first column) and accuracy values (second coloumn) using different deep-learning models using Dataset 2 during 30 epochs.
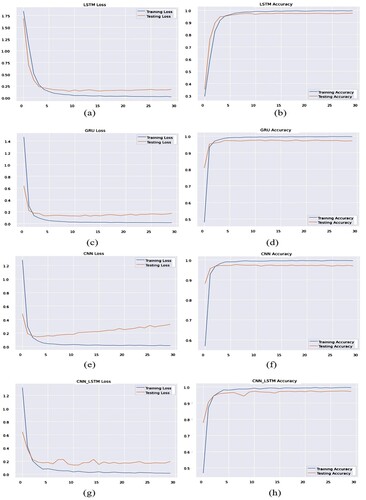
Table 7. Deep-learning model performance with 30 epochs (Dataset 2).
Table 8. Comparison of model predictions on Dataset 1.
Table 9. Overall classification report of the deep-learning models.
Figure 6. Graphical representation of prediction of models.
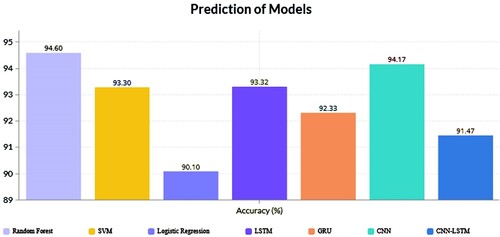
Figure 7. Confusion matrix on RF model prediction.
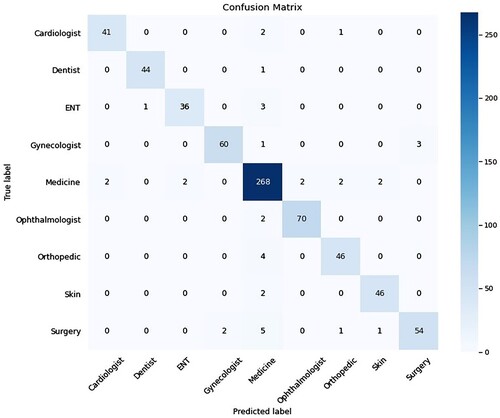
Table 10. Prediction table for specialist with correct classification.
Table 11. Prediction table for specialist with incorrect classification.