
Figures & data
Figure 1. A workflow for Cyberattack alert and data collection by V. K. Nguyen et al. (Citation2019).
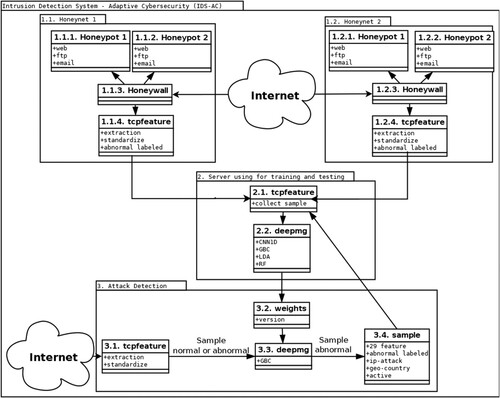
Figure 2. Honeynet architecture collects network attack data.
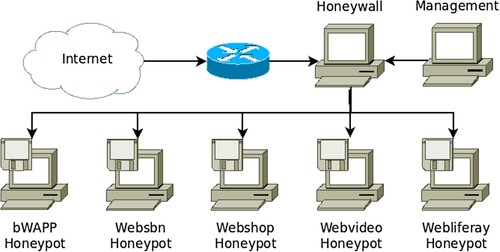
Figure 3. Container of a Honeynet Architecture for actual data collection.
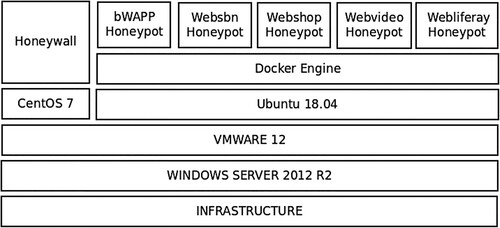
Table 1. Information extracted from alert.
Table 2. General attack type collected.
Figure 4. Threats detected by various approaches. (a) Honeynet. (b) Firewall.
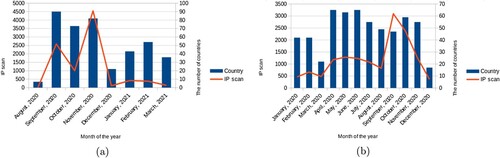
Figure 5. Distribution of locations where accessed our experimental servers exhibited on a world map.
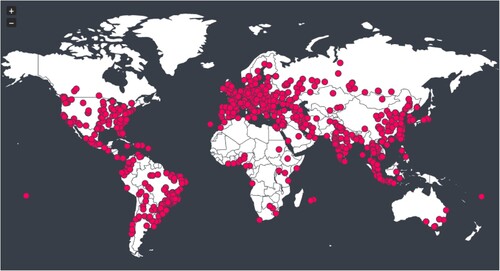
Table 3. Emails of spam and malware in 2020 collected via Firewall.
Table 4. 29 characteristics of network attack data.
Table 5. Information about the number of records of the two experimental datasets.
Figure 6. Percentage distribution of classes in collected data. The left chart reveals the data class distribution of the binary classification tasks, while the other exhibits 4-class classification tasks.
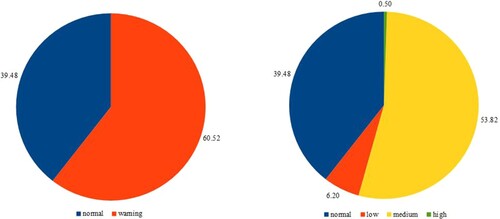
Figure 7. LDA-based classification data representation.
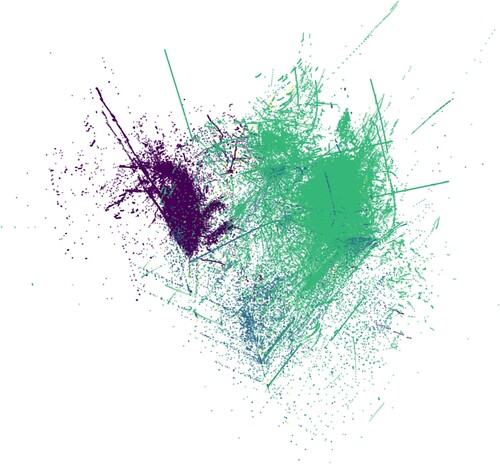
Figure 8. Performance comparison of classic machine learning and deep learning algorithms. The X-axis includes abbreviations of the method names, while Y-axis shows the accuracy metric.
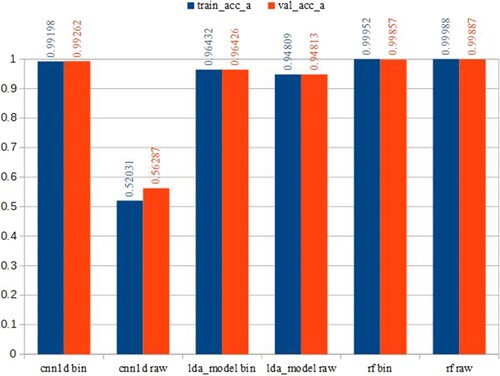
Figure 9. Training and testing results with ACC and AUC measurements. The X-axis includes abbreviations of the method names while Y-axis shows the numbers ranging from 0.5 to 1 to reveal the performance in accuracy and AUC.
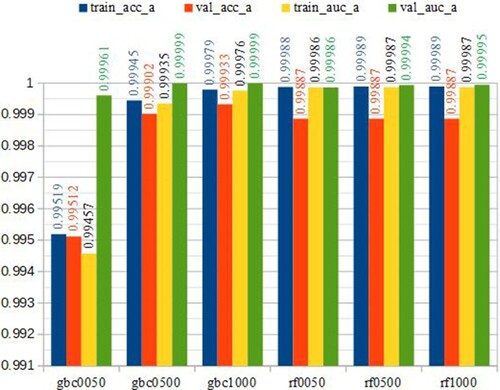
Figure 10. Results of ACC and AUC with different filters on CNN1D.
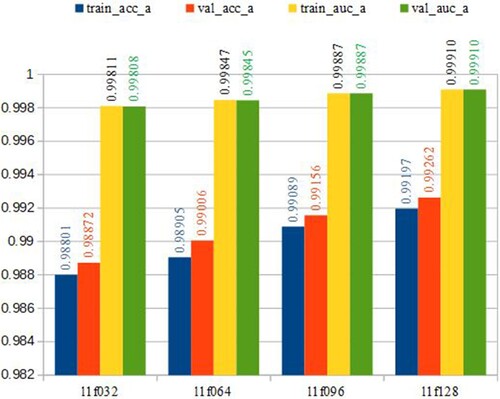
Figure 11. ACC and AUC results with different numbers of convolution layers.
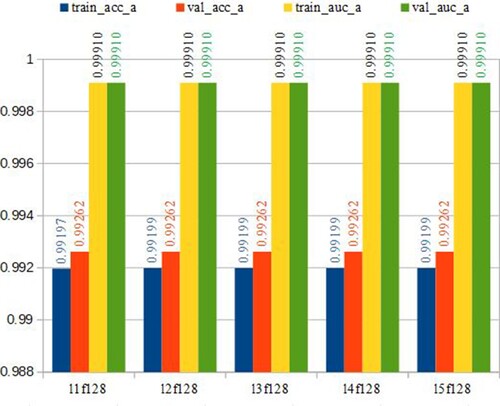
Figure 12. The results in the accuracy of training and testing phases for the 2-class and 4-class classification problems.
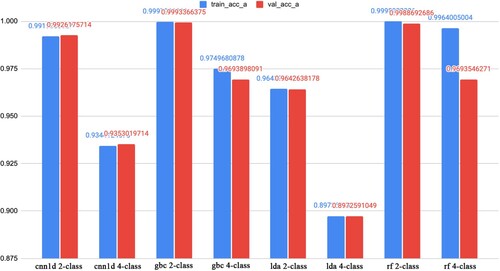
Table 6. Performance comparison in accuracy on the test set between 2-class and 4-class classification tasks with various learning algorithms.
Figure 13. Training time (in seconds in the y-axis) of the classification task.
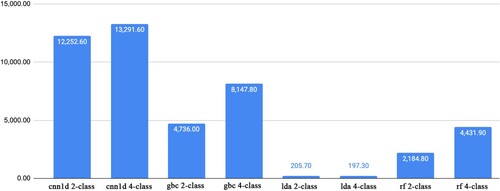
Table 7. General attack type obtained after ten days.
Table 8. Comparison of providing warnings between IDS-AC and Snort.
Availability of data, code, and material
Data and experimental scripts and data of this study are published at the Github repository link https://github.com/dzokha/ids-ac.