
Figures & data
Figure 1. The study methodology we used.
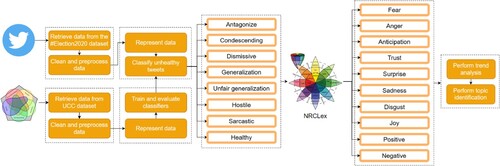
Table 1. Mean ROC-AUC score of the classifiers.
Figure 2. ROC curves and ROC-AUC scores for each attribute, for the XLNet model we trained.
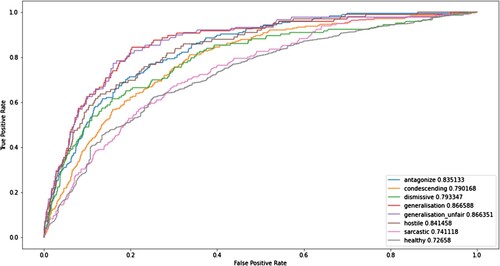
Figure 3. Tweet trends by unhealthy attribute cluster and by the proportion of unhealthy tweets relative to the total number of tweets.
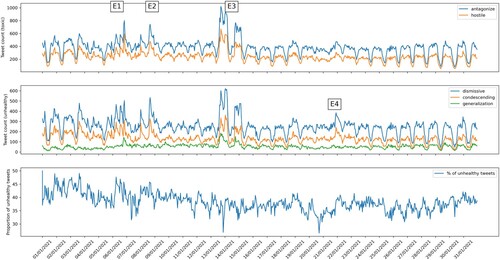
Figure 4. Correlogram of unhealthy attributes vs. the NRCLex sentiments, computed with Cramer’s V-measure.
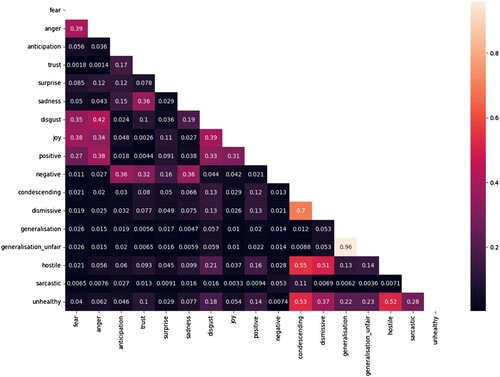
Figure 5. Radar plots showing the proportion of tweets exhibiting the sentiment for each sub-attribute.
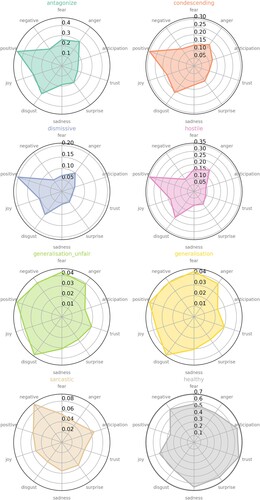
Table 2. Most relevant topics.
Figure 6. Network formed of LDA topics (nodes) linked by cosine similarity scores (edges). Only scores ≥ 0.5 have been included.
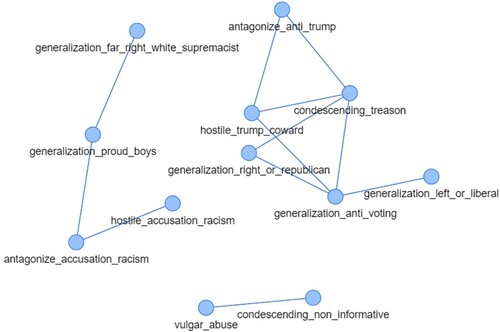
Table 3. Topics computed for attribute-emotion pairs (selection).