Figures & data
Figure 1. RIS-assisted network model.
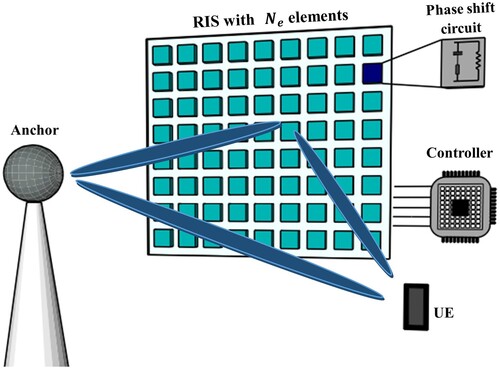
Figure 2. Signal model for RIS-aided localization.
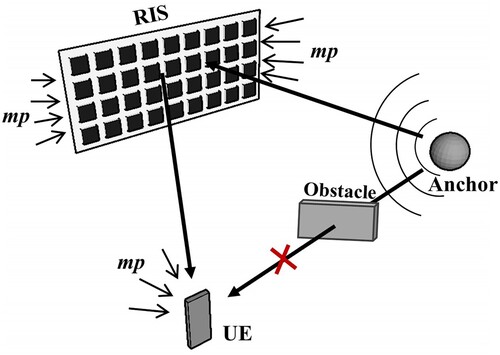
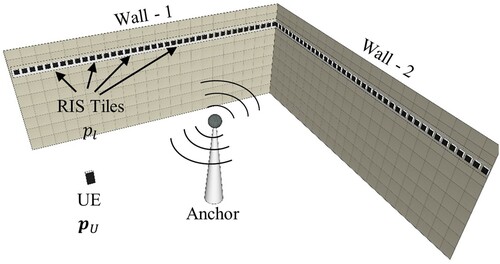
Figure 3. Considered system scenario.
Table
Figure 4. GDoP for 10–60% of total tiles, (a) to (f) respectively, from the largest SNR for ToA measurements in each wall.
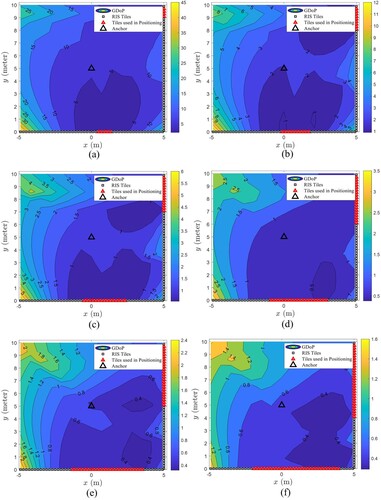
Figure 5. GDoP for 10–60% of total tiles, (a) to (f) respectively, from the largest SNR for ToA measurements in each subdivided wall.
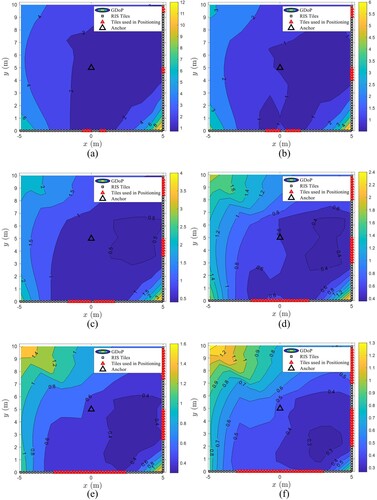
Figure 6. GDoP for some combinations use 5% of the tiles on each wall.
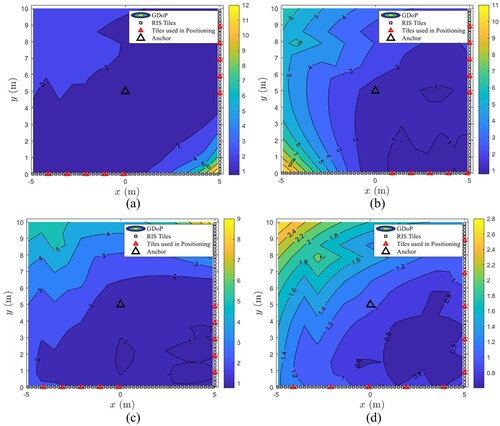
Figure 7. GDoP for some combinations use 7% and 3% of the tiles 1st and 2nd wall.
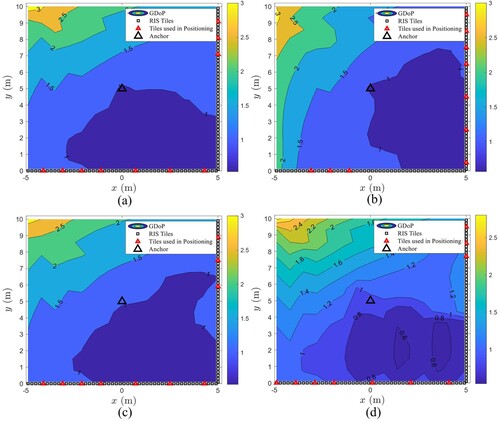
Table 1. Used notations and parameters.
Figure 8. Empirical CDF of the estimation error for different percentages of selected tiles compared with the proposed GDoP method.
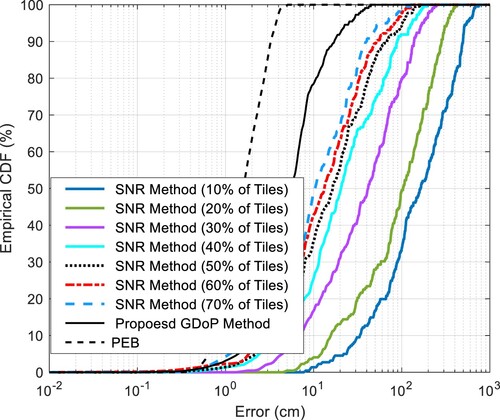
Figure 9. Average localization error vs number of symbols transmission for different percentages of selected tiles compared with the proposed GDoP method (a) The overall CDF curves; (b) enlarged view of CDF curves.
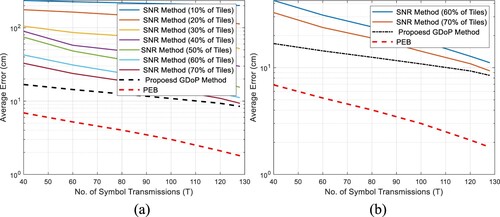
Figure 10. Bar chart for average localization error vs different percentages of selected tiles compared with the proposed GDoP for different number of symbol transmission (T).
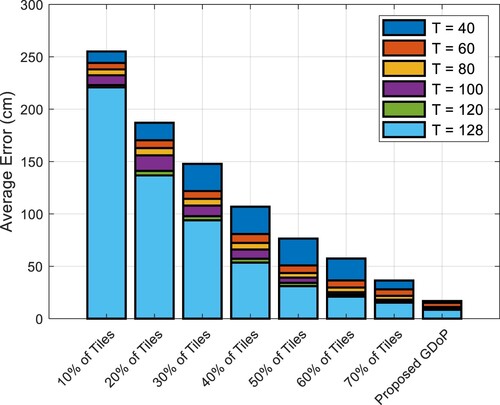
Figure 11. The cumulative distribution functions of the GDoP.
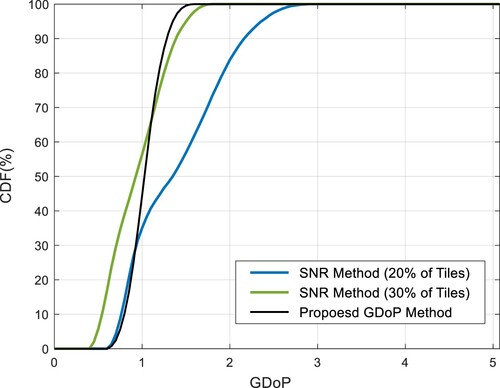
Figure 12. Empirical CDF of the estimation error for different numbers of OFDM subcarrier numbers at 60% of the tiles compared with the proposed GDoP method.
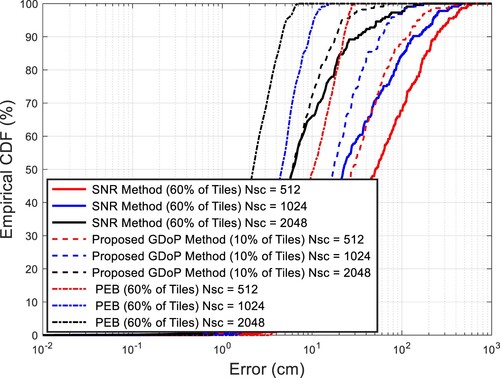
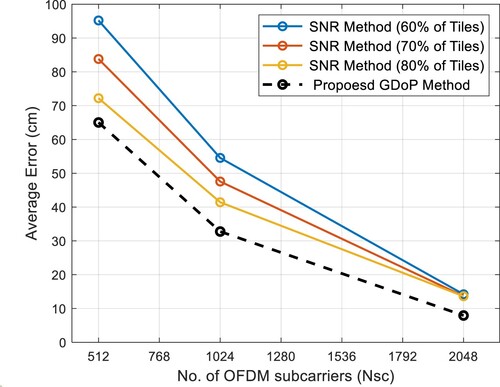
Figure 13. Average localization errors for different numbers of OFDM subcarrier at 60%, 70% and 80% of the tiles for SNR method compared with the proposed GDoP method.