Figures & data
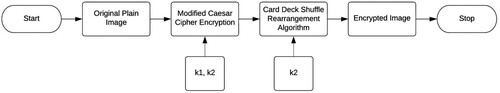
Figure 1. Block diagram of proposed methodology.
Algorithm 1. Key Extraction Algorithm
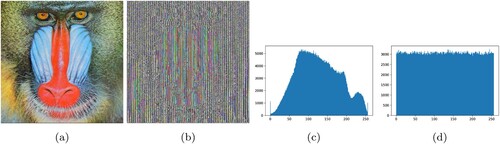
Figure 2. Classic Caesar Cipher encryption on Baboon image, (a) Original Baboon image, (b) Encrypted Baboon image, (c) Original Baboon image histogram, (d) Encrypted Baboon image histogram.
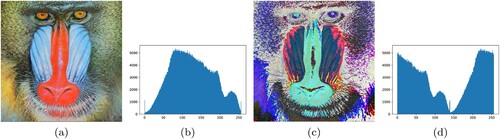
Figure 3. Classic Caesar Cipher encryption on Lena image, (a) Original Lena image, (b) Encrypted Lena image, (c) Original Lena image histogram, (d) Encrypted Lena image histogram.
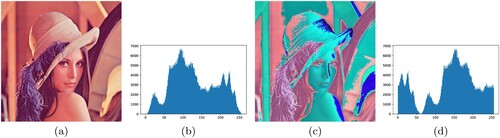
Figure 4. Modified Caesar Cipher encryption on Baboon and Lena image, (a) Original Baboon image, (b) Encrypted Baboon image, (c) Original Baboon image histogram, (d) Encrypted Baboon image histogram.
Algorithm 2. Modified Caesar Cipher Algorithm
Figure 5. Modified Caesar Cipher encryption on Baboon and Lena image, (a) Original Lena image, (b) Encrypted Lena image, (c) Original Lena image histogram, (d) Encrypted Lena image histogram.
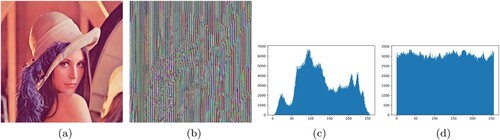
Figure 6. Block diagram of modified Caesar Cipher.
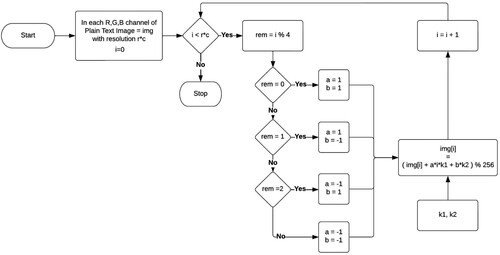
Figure 7. Block diagram for calculating decksizeArray.
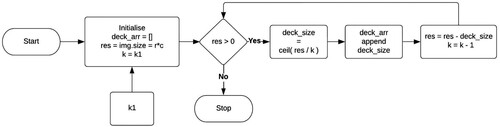
Figure 8. Card Deck Shuffle Rearrangement.
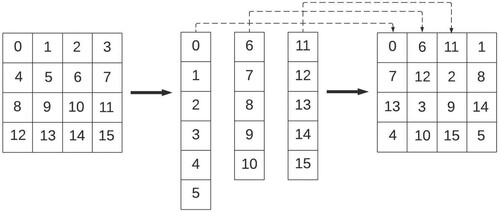
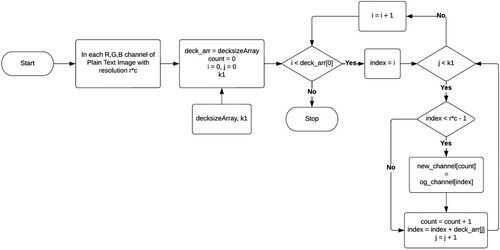
Figure 9. Block diagram of Card Deck Shuffle Rearrangement Algorithm.
Algorithm 3. Decksize Array Calculation Algorithm
Algorithm 4. Decksize Array Calculation Algorithm
Figure 10. (a) Original Peppers image, (b) Image after Modified Caesar Cipher encryption, (c) Final encrypted image after Card Deck Shuffle Rearrangement, (d) Decrypted image.
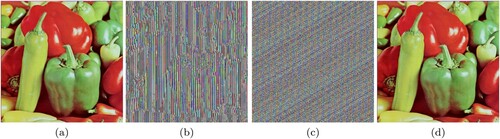
Figure 11. (a) Original Tulips image, (b) Image after Modified Caesar Cipher encryption, (c) Final encrypted image after Card Deck Shuffle Rearrangement, (d) Decrypted image.
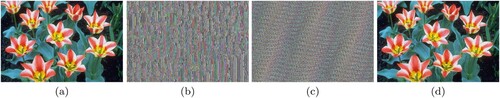
Figure 12. (a) Original Cat image, (b) Image after Modified Caesar Cipher encryption, (c) Final encrypted image after Card Deck Shuffle Rearrangement, (d) Decrypted image.
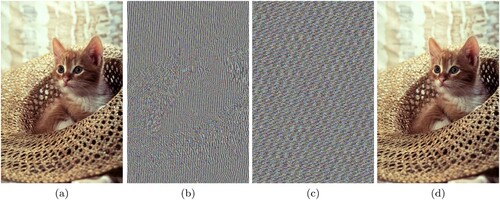
Figure 13. (a) Original House image, (b) Image after Modified Caesar Cipher encryption, (c) Final encrypted image after Card Deck Shuffle Rearrangement, (d) Decrypted image.
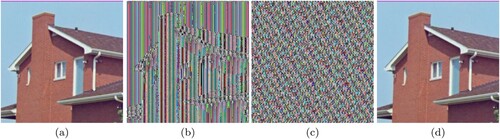
Figure 14. (a) Original Lena image, (b) Image after Modified Caesar Cipher encryption, (c) Final encrypted image after Card Deck Shuffle Rearrangement, (d) Decrypted image.
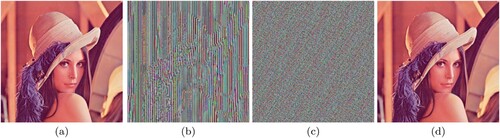
Figure 15. (a) Original Baboon image, (b) Image after modified Caesar Cipher encryption, (c) Final encrypted image after Card Deck Shuffle Rearrangement, (d) Decrypted image.
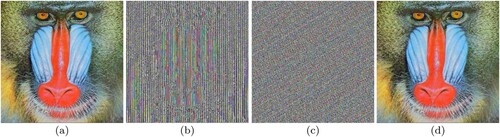
Figure 16. Image encryption results by applying modified Caeser Cipher and Card Deck Shuffle rearrangement algorithm. Histograms are for the entire image. (a) Encrypted Peppers image. (b) Overall Histogram of (a). (c) Histogram of Red Channel of (a). (d) Histogram of Green Channel of (a). (e) Histogram of Blue Channel of (a). (f) Encrypted Cat image. (g) Overall Histogram of (f). (h) Histogram of Red Channel of (f). (i) Histogram of Green Channel of (f). (j) Histogram of Blue Channel of (f). (k) Encrypted Tulips image. (l) Overall Histogram of (k). (m) Histogram of Red Channel of (k). (n) Histogram of Green Channel of (k) (o) Histogram of Blue Channel of (k). (p) Encrypted House image. (q) Overall Histogram of (p). (r) Histogram of Red Channel of (p). (s) Histogram of Green Channel of (p). (t) Histogram of Blue Channel of (p). (u) Encrypted Lena image. (v) Overall Histogram of (u). (w) Histogram of Red Channel of (u). (x) Histogram of Green Channel of (u). (y) Histogram of Blue Channel of (u) (z) Encrypted Baboon image. (aa) Overall Histogram of (z). (ab) Histogram of Red Channel of (z). (ac) Histogram of Green Channel of (z) and (ad) Histogram of Blue Channel of (z).
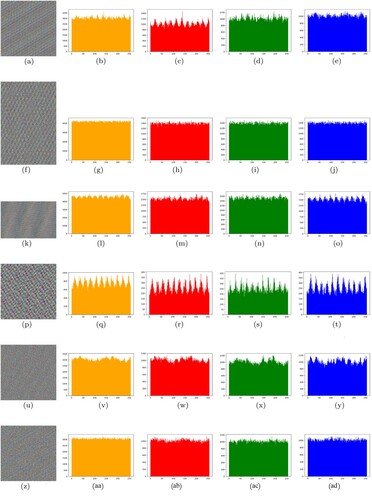
Figure 17. Key Sensitivity Analysis for Cat Image (Key B was obtained when one bit was changed in key A). (a) Original Cat Image. (b) Encrypted Image with key A. (c) Encrypted Image with key B and (d) Difference between (b) and (c).
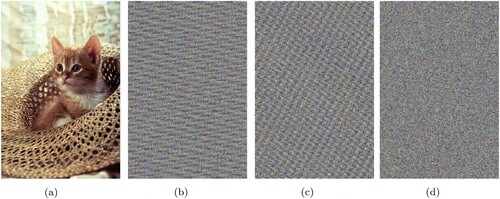
Figure 18. Correlation analysis: Visualisation of the (input) original Lena image along the, (a) horizontal, (b) vertical, (c) diagonal directions respectively. Visualisation of the encrypted image along the, (d) horizontal, (e) vertical, (f) diagonal directions respectively.
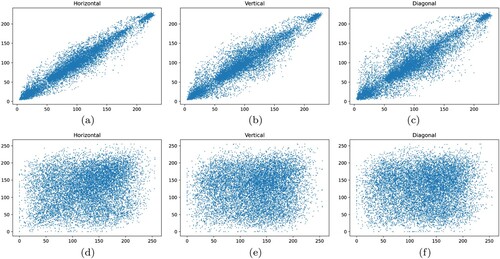
Figure 19. Tulips, (a) source image (b) decrypted image (c) image depicting difference in (a) and (b).
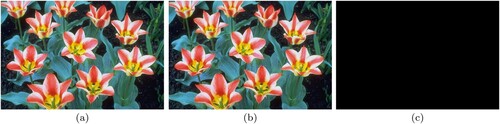
Figure 20. House, (a) source image (b) decrypted image (c) image depicting difference in (a) and (b).
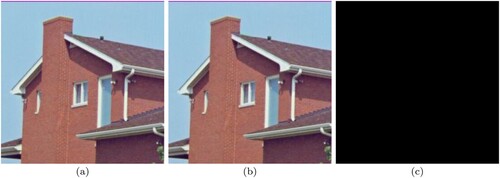
Figure 21. Noise resistance analysis: (a) original Peppers image, (b) encrypted Peppers image, (c) encrypted Peppers image with noise added by changing values of 128*128 = 16,384 pixels, (d) decrypted Peppers image.
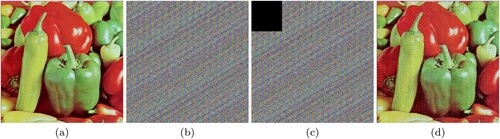
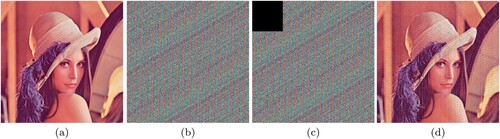
Figure 22. Noise resistance analysis: (a) original Lena image, (b) encrypted Lena image, (c) encrypted Lena image with noise added by changing values of 128*128 = 16,384 pixels, (d) decrypted Lena image.